

Strategy notes..5 min read
Max drawdown is a record, not a limit
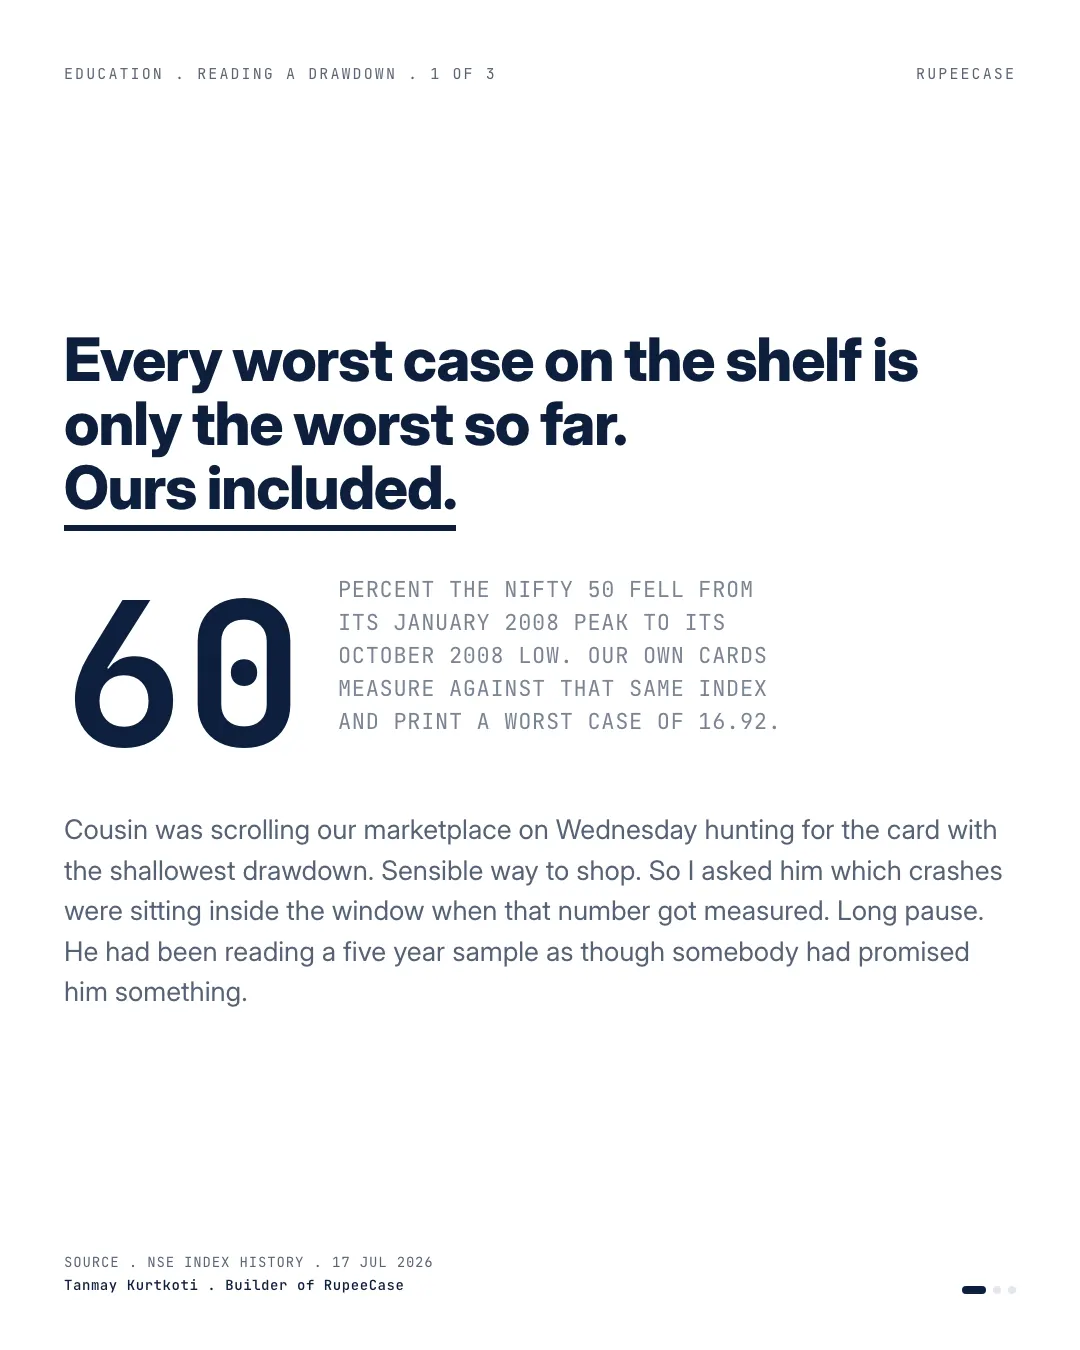
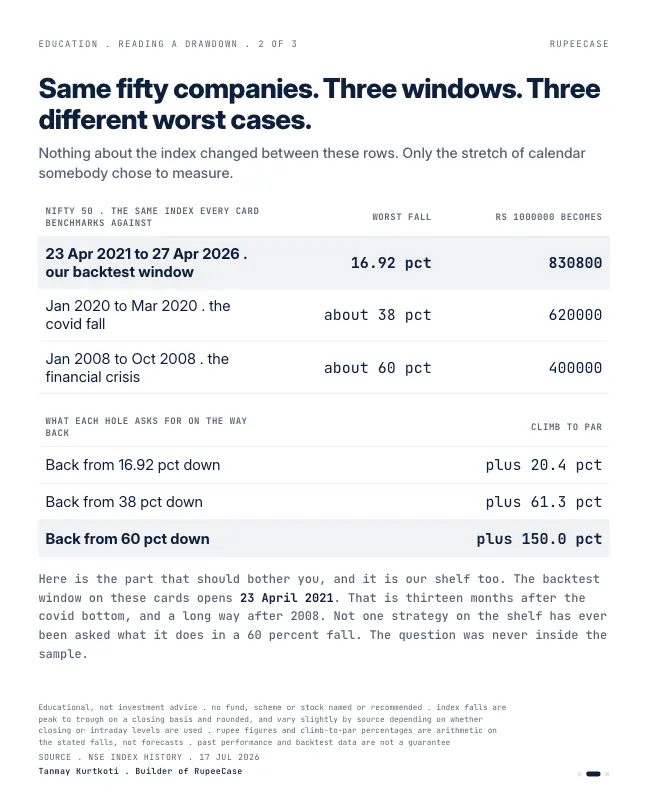
The Nifty's worst fall inside the backtest window is 16.92 percent, against about 38 percent in 2020 and 60 percent in 2008, so double the worst number you see.
Model, back tested, as of 27 Apr 2026, as published then; the strategy page shows the current figure.
By Tanmay Kurtkoti, founder of QC Alpha and builder of RupeeCase
Cousin was scrolling our marketplace on Wednesday, hunting for the card with the shallowest drawdown. Sensible way to shop. Most people do exactly that.
So I asked him which crashes were sitting inside the window when that number got measured.
Long pause.
Here is the thing I think most people get wrong about a track record. A maximum drawdown is not a limit. It is a record. It says: across this particular stretch of calendar, this was the worst it ever got. It has never once said anything about what happens next.
And the stretch of calendar is doing enormous work.
Our own backtest window runs 23 April 2021 to 27 April 2026. Inside it, the Nifty 50's worst fall is 16.92 percent. Same index, January to March 2020: roughly 38 percent. Same index, January to October 2008: roughly 60 percent. Nothing about those fifty companies changed between those numbers. Only the window.
On Rs 10,00,000, that is 8,30,800 left, or 6,20,000, or 4,00,000. The climb back is worse than the fall suggests, because it always is. Plus 20.4 percent gets you home from the first one. Plus 150.0 percent from the last.
The uncomfortable bit, and it is our shelf too: that window opens thirteen months after the covid bottom. Not one strategy on it has been asked what it does in a 60 percent fall. The question was never in the sample. Every shelf in this country is quoting a worst case measured inside the calmest stretch it could find, and none of them are lying. They just cannot show you a crash that their data does not contain.
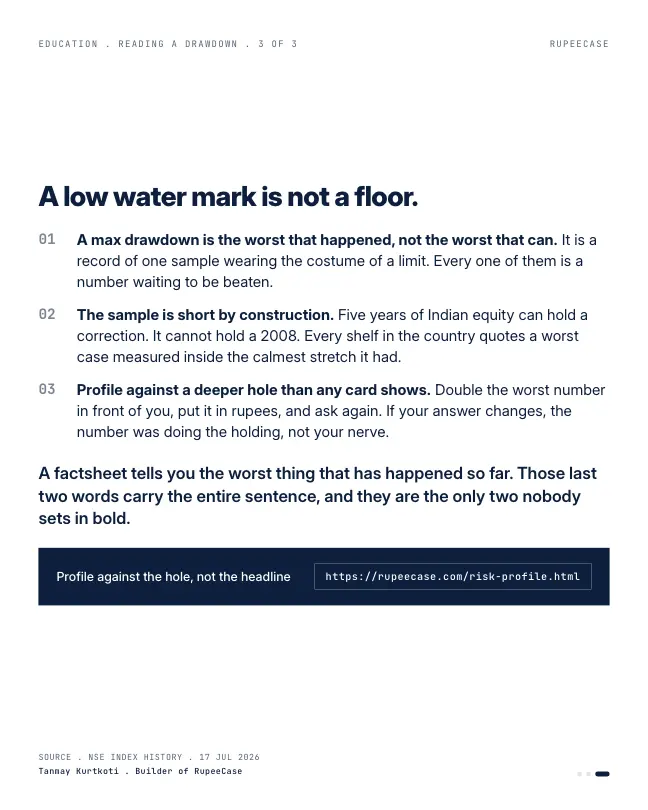
So when you are sizing your nerve against a card, double the worst number you see, put it in rupees, and ask the question again. If your answer changes, the number was doing the holding, not you.
A factsheet tells you the worst thing that has happened so far. Those last two words carry the whole sentence, and they are the only two nobody sets in bold.
Most of our worst cases are one event
I went back to the shelf with the cousin's question in mind and found something that makes the point sharper. On the monthly model values, sixteen of our eighteen cards hit the bottom of their worst fall in the same month: Feb 2025. The exceptions are Healthcare Basket, whose worst stretch ended in Jun 2022, and Dynamic Asset Allocator, a younger card whose shallow worst fall ended in Mar 2026 (Model, back tested nav files).
of 18 cards had their deepest month end fall bottom in Feb 2025
Model, back tested, RupeeCase nav files
back test window, 23 Apr 2021 to 27 Apr 2026
RupeeCase Allcap factsheet
the Nifty 50's worst fall inside that window
Factsheet benchmark column, as of 27 Apr 2026
So when you compare maximum drawdowns across the shelf, you are mostly comparing how each card handled one correction. That is useful: it was a real, sharp fall, and the cards behaved very differently in it. But it is one sample. A different kind of fall, longer or led by different sectors, could rank them differently.
- Energy Basket-39.48%
- Microcap-26.43%
- Allcap-22.72%
- Large Midcap-19.31%
- Nifty 50 Equal Weight-15.71%
- Dynamic Asset Allocator-10.57%
Maximum drawdown, six of eighteen cards. Model, back tested, as of 27 Apr 2026. RupeeCase lineup.json.
Double it, in rupees
The opening's habit is simple enough to make a calculator of. Take the worst number on the card, double it, put it in rupees, and see whether your answer changes. Doubling is not a forecast. It is a way of asking the question with a fall the sample did not contain.
On Rs 10 lakh in Allcap, the record says a fall to about Rs 7.73 lakh. Doubled, about Rs 5.46 lakh, and an 83 percent climb to get back. If the second number makes you want a different card, or a smaller amount, it is better to find out on a calm day.
Why a back test cannot show what it never saw
- Back test window opens
The first day of the five year sample every card is measured on.
- The window's main correction
Sixteen of eighteen cards record their worst month end fall here.
- Window closes
Every maximum drawdown on the shelf is measured inside these five years.
A back test is a sample of history, and its worst case is the worst case in the sample. Out of sample, the future is free to be worse. This is the same problem that sits under any strategy test: the more a rule's figures depend on one stretch of market, the more they can change when the stretch ends. The honest response is not to distrust the record. It is to read it as a floor on the pain, never as a ceiling.
MythA strategy's maximum drawdown is the most it can lose.
FactIt is the most it lost in the window measured. On our shelf, that window holds one main correction.
The free Learn module on building strategies that survive out of sample covers why back test figures shrink in live trading and how to stress a rule, with a quiz. The drawdown recovery calculator works out the climb back from any fall. Related: drawdown is the KPI nobody asks about and Smallcap, the honest year.
Questions readers ask
Is maximum drawdown the worst a strategy can lose?
No. It is the worst fall within the period measured. RupeeCase's model back tests run from 23 Apr 2021 to 27 Apr 2026, and for sixteen of eighteen cards the worst fall came in one correction that bottomed in Feb 2025 (Model, back tested). A different market can produce a deeper fall.
How do I stress test a portfolio's drawdown?
A simple method is to take the recorded maximum drawdown, multiply it, often by two, and put the result in rupees on your own amount. A 22.72 percent drawdown doubled is about 45 percent, which needs an 83 percent rise to recover.
Why do back test results look better than live results?
A back test sees only the history it covers and is often built or chosen after seeing that history. Live markets bring falls and conditions the sample did not contain, so figures measured out of sample are usually weaker than the back test.
The cards
3 cards. Swipe, or tap to open.
Explore next
Learn it properly, then see it applied.
Reading path
Stop 8 of 8 on Before you pick a card
Related
- The shallow fall compoundsSorted by max drawdown instead of CAGR, Large Mid Multi Asset's 17.61 percent hole was the shallowest in the table and its 2025, up 10.1 percent, the best in the table.Strategy notes . . 9 min
- You sorted by return. Here is what you missed.Re sorting the shelf by Calmar moves Midcap Smallcap from rank two to eight and Large Mid Multi Asset from ten to four, because the recovery column is the one that matters.Strategy notes . . 9 min
- Drawdown is the KPI nobody asks aboutTwo RupeeCase cards share the same 80/10/10 recipe and differ only in universe; the narrower one gave up 6.45 points of CAGR and saved 3.74 points of drawdown.Strategy notes . . 6 min
Educational content only. Figures are illustrative and computed on historical or representative data for teaching purposes, not investment advice. Past performance does not guarantee future returns. Sourced from NSE, BSE, SEBI, AMFI and RBI public data.