

Factors..6 min read
Momentum factor primer
Momentum means ranking on twelve months with the latest month skipped, a premium of about four points a year in India, paid out lumpy and interrupted by three crashes.
By Tanmay Kurtkoti, founder of QC Alpha and builder of RupeeCase
Saturday morning. A friend messages me a screenshot of a momentum basket down 18 percent for the year. He wants to know if momentum stopped working.
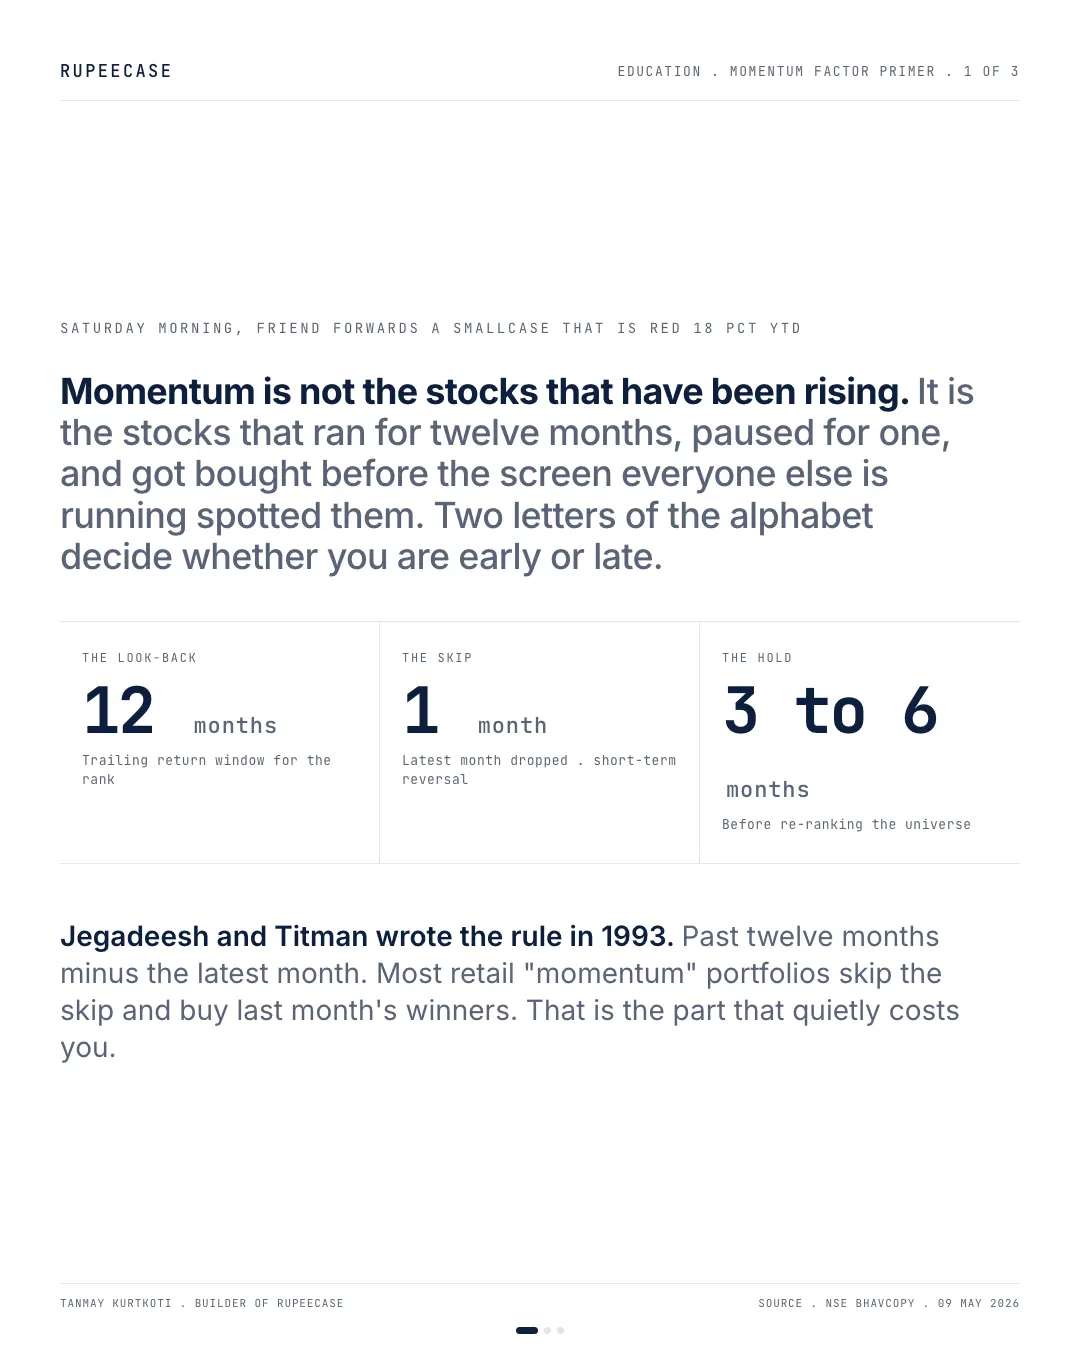
Honest version. Momentum is not the stocks that have been rising. It is the stocks that rose for twelve months, paused for one month, and got bought before the screen everyone else is running spotted them. Two letters of the alphabet decide whether you are early or late, and most retail momentum portfolios skip the letter that matters.
Jegadeesh and Titman wrote the rule in 1993. Look back 12 months. Drop the latest month. Rank the universe on the 11-month window. Buy the top decile. Hold for 3 to 6 months. Re-rank. The skip month exists because the latest month tends to reverse. The classic short-term reversal effect. A screen that ranks on "last 12 months" is buying the part the textbook said to sell. Same factor name. Different factor.
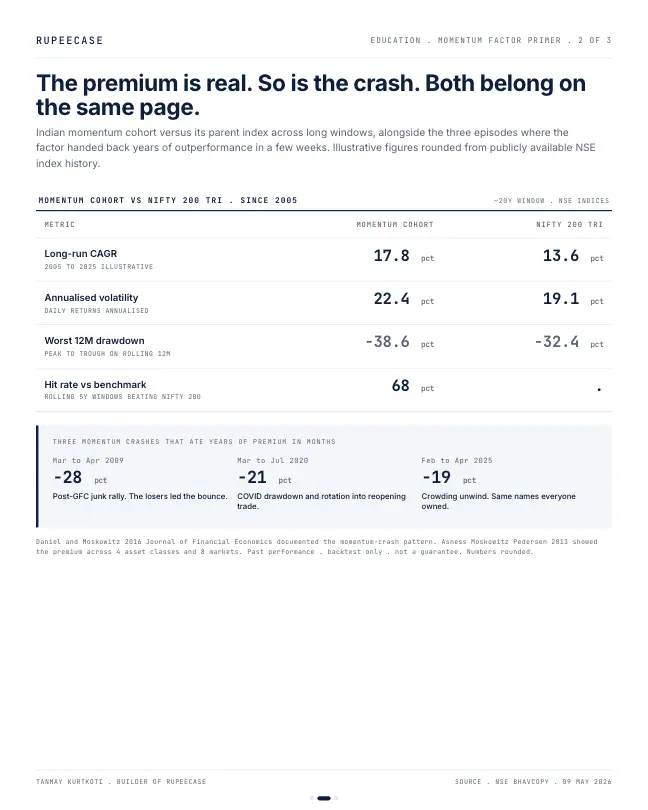
The premium is real. On a 20-year window an Indian momentum cohort compounded near 17.8 percent against Nifty 200 TRI at 13.6 percent. About four percentage points a year, paid out lumpy not smooth. The bill is real too. Worst 12-month drawdown of -38.6 percent versus -32.4 for the parent index. Three momentum crashes did most of the damage. Post-GFC junk rally in early 2009 cost -28. The COVID drawdown and reopening rotation in 2020 cost -21. The Feb to Apr 2025 crowding unwind cost -19. Each one ate years of premium in weeks.
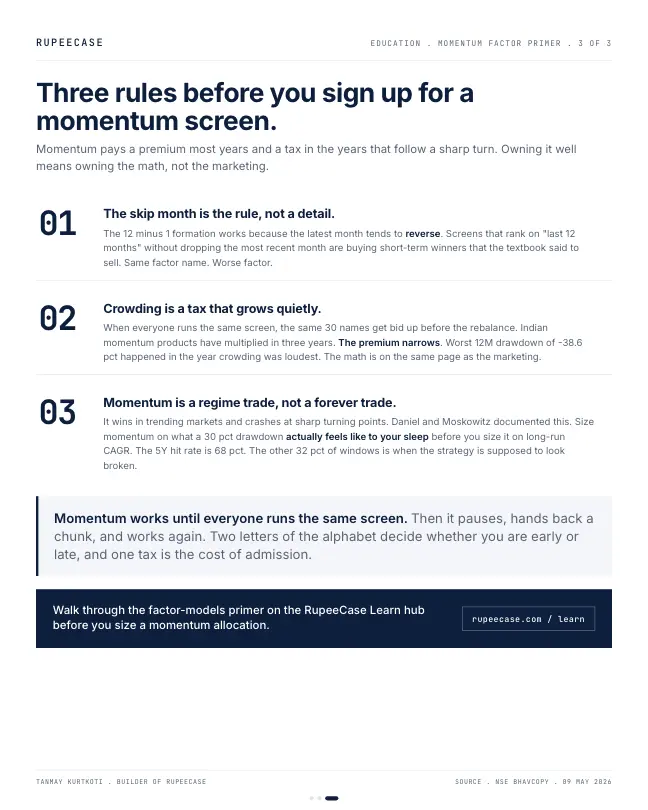
So three rules before you sign up. The skip month is the rule, not a detail. Crowding is a tax that grows quietly when everyone runs the same screen. And momentum is a regime trade, not a forever trade. The 5Y rolling hit rate is 68 percent. The other 32 percent of windows is when the strategy is supposed to look broken.
Read the rule, size on the drawdown, sit through the windows that look broken
The rule, one step at a time
The classic recipe fits in five steps. Each step is a decision, and changing any one of them gives you a different portfolio that still calls itself momentum.
- Look back 12 monthsTake each stock's price 12 months ago and its price one month ago.
- Skip the latest monthThe last month tends to reverse, so it is left out of the score.
- Rank the whole universeScore every stock on the same window, from best to worst.
- Hold the top sliceBuy the top tenth, hold for 3 to 6 months.
- Rank againSell what dropped out, buy what came in, on a fixed date.
What the skip month changes, in numbers
Take Company A. Thirteen months ago it traded at Rs 100. A month ago it was Rs 150. Today, after a sharp final month, it is Rs 165. A screen on the last 12 months scores it at 65 percent. The classic rule scores it at 50 percent, because the Rs 15 jump of the latest month is the part most likely to give back. Two stocks with the same 12 month return can rank far apart once that month is removed.
NSE's own momentum index uses a different refinement. The Nifty200 Momentum 30 takes each stock's 6 month and 12 month returns, divides each by the stock's volatility, turns them into scores against the rest of the Nifty 200 and averages the two. The top 30 are held and the list is rebalanced every June and December. Dividing by volatility rewards a steady climb over a wild spike, which does some of the same work the skip month does.
What NSE's indices show
The long run edge is visible in NSE's published factsheets. On total return, the Nifty200 Momentum 30 compounded at 18.30 percent a year since April 2005, against 13.46 percent for the Nifty 200, according to the factsheets of 30 Sep 2026. The years before its August 2020 launch are NSE's back calculation, so treat them as a model.
- Midcap150 Momentum 5022.22%
- Nifty Alpha 5020.21%
- Nifty200 Momentum 3018.30%
- Nifty 20013.46%
Total return CAGR since base date (Apr 2005; Nifty Alpha 50 and Nifty 200 from 2004), to 30 Sep 2026. Years before each launch are back calculated. NSE Indices factsheets, 30 Sep 2026.
The same factsheets show the bill. Over the last five years, all of them live, the Momentum 30 earned 9.28 percent a year against 8.30 percent for the Nifty 200, a much thinner edge, with a five year beta of 1.18 and volatility of 19.4 percent. The last two years show what that looks like from the inside.
Between October 2024 and April 2025 the momentum index lost about 30 percent while the Nifty 500 lost about 14 percent. Its deepest fall in the two years to 9 Oct 2026 was 30.7 percent. Two years on, it was still 21.5 percent below where it started.
Rebased to 100 in Oct 2024, the Nifty200 Momentum 30 fell to 70.4 by Apr 2025 and stood at 78.5 in Oct 2026; the Nifty 500 was at 92.7.
NSE index closes on the 9th of each quarter month, 9 Oct 2024 to 9 Oct 2026, price only, rebased to 100.
Size on the drawdown, not the CAGR
A 30.7 percent fall needs a 44.3 percent gain just to get back to where it started. That is the number to plan around. If a sleeve that falls 30 percent would push you to sell, the sleeve is too big, however good the long run table looks. The drawdown recovery calculator shows the climb back for any fall.
Most of the RupeeCase lineup ranks on momentum. Allcap ranks the Nifty Total Market, holds the top 50 at equal weight and rotates every two weeks: its model figures are a 44.70 percent CAGR with a worst fall of 22.72 percent (Model, back tested, as of 27 Apr 2026). The free Learn module on the momentum factor covers the crashes, the costs of turnover and the NSE indices in full, with a quiz. The follow up post, momentum pays, then bites, picks up the drawdown side.
Questions readers ask
What is the skip month in momentum investing?
It is the most recent month, left out when stocks are ranked on past returns. The classic rule ranks on the return from 12 months ago to 1 month ago, because very short term winners tend to give some of the gain back. A stock that rose from Rs 100 to Rs 165 over a year, with the last Rs 15 in the final month, scores 50 percent instead of 65.
How has the Nifty200 Momentum 30 performed?
On NSE's factsheet of 30 Sep 2026 it compounded at 18.30 percent a year on total return since April 2005, including back calculated years before its 2020 launch, against 13.46 percent for the Nifty 200. Over the two years to 9 Oct 2026 its price fell 21.5 percent, with a deepest fall of 30.7 percent.
Why does momentum crash?
Momentum holds recent winners, so when the market turns sharply those winners can fall fastest while beaten down stocks rebound. Long only momentum indices also carry the market's own fall. In the six months from Oct 2024 to Apr 2025 the Nifty200 Momentum 30 lost about 30 percent against about 14 percent for the Nifty 500.
The cards
3 cards. Swipe, or tap to open.
Related
- Momentum pays, then bitesMomentum's winner minus loser portfolio runs a 0.71 Sharpe since 1927 and lost about 91 percent in two months of 1932 while the market rose 82, because the crash is the short leg.Factors . . 13 min
- Quality: the factor that pays in the bear marketFour spreadsheet screens separate a quality cohort with a 7.4 percent twelve month drawdown from a junk cohort at 38.6, and recovery asymmetry does the rest.Factors . . 5 min
- Cheap for a reason: value or trapThe cheapest Nifty 500 names split by free cash flow trend compounded at 14.6 percent and 3.2 percent over a decade, from the same doorway.Factors . . 5 min
Educational content only. Figures are illustrative and computed on historical or representative data for teaching purposes, not investment advice. Past performance does not guarantee future returns. Sourced from NSE, BSE, SEBI, AMFI and RBI public data.