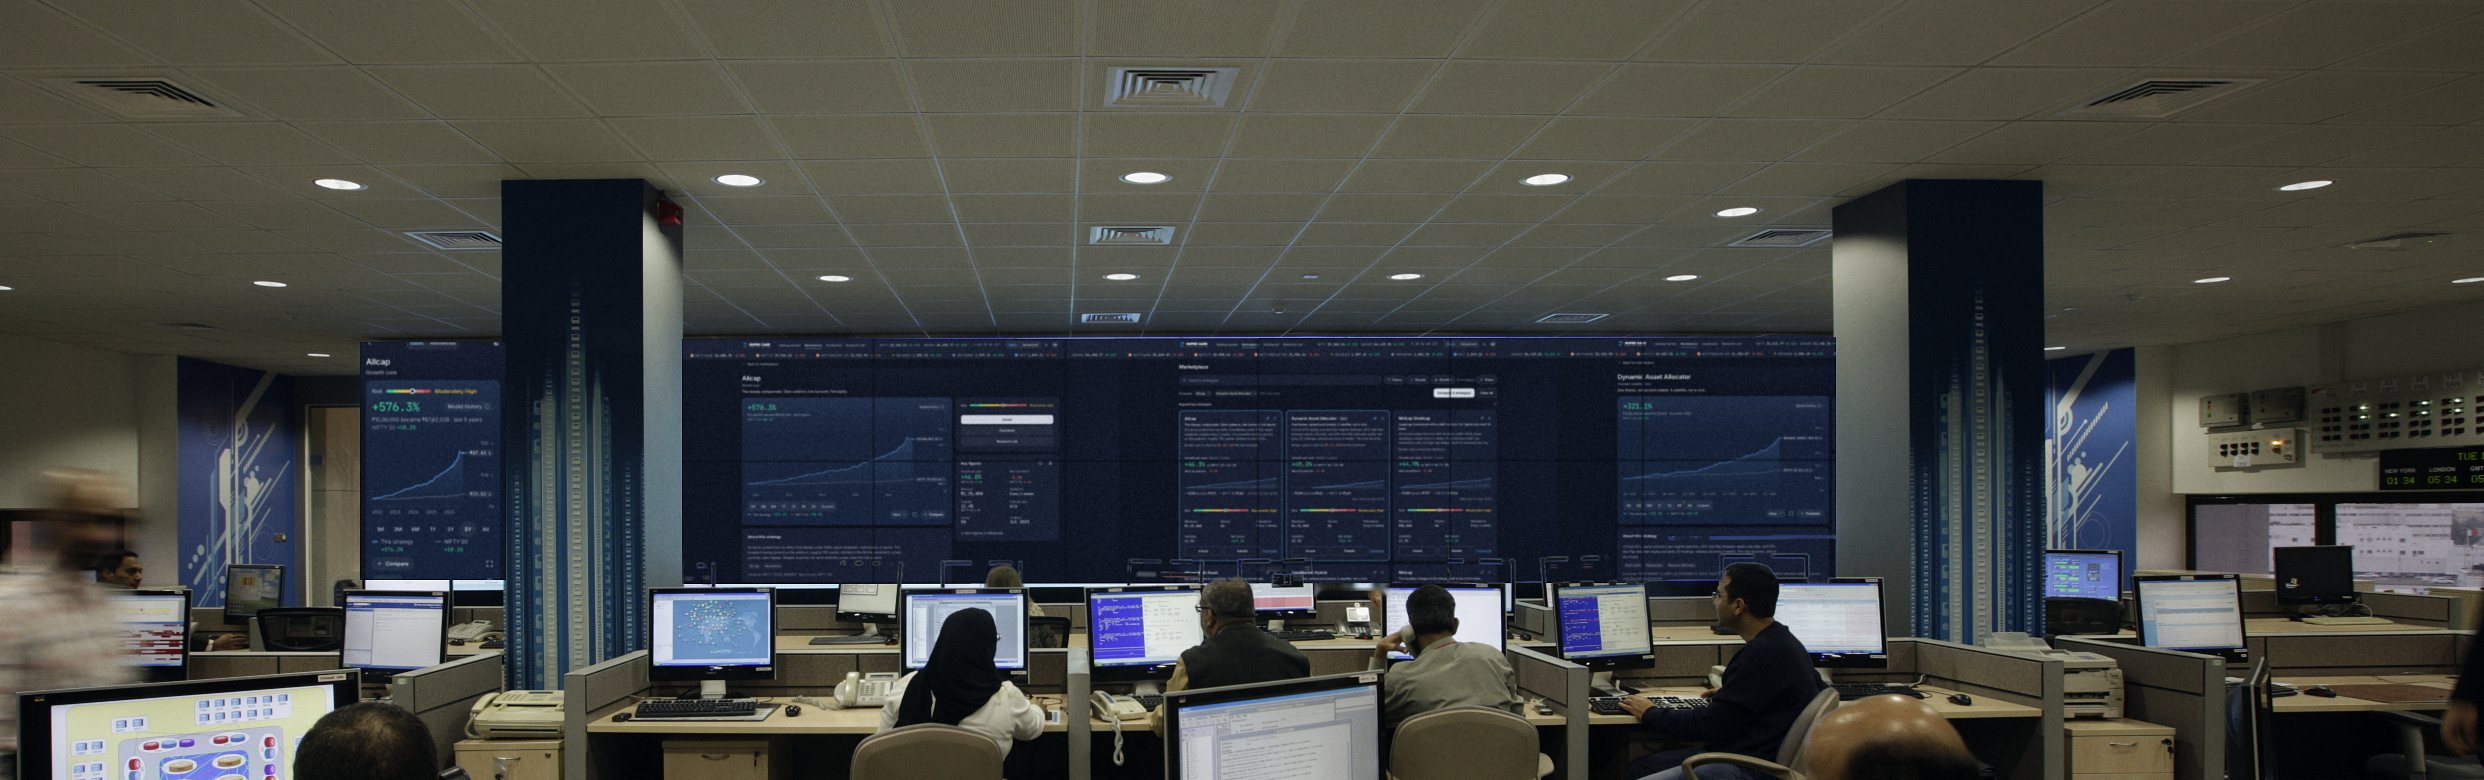
What is the RupeeCase prediction scorecard?
A public table of recent predictions from The Tanmay Edge podcast, with the grade each one earned. Through Season 2 (16 Mar to 16 Sep 2026) each episode locked five specific predictions on Indian markets before the open, and the set was read only after the open bell. The season has ended; the record stays as published, with its dates, and the data is published as JSON.
How is a prediction graded?
Each call is checked against the official NSE close and BhavCopy data. A hit printed exactly as stated. A partial was directionally right but missed magnitude or timing. A miss failed. If the option setup paid out on a different spot path, it is counted separately as mechanic fired.
How is the hit rate computed?
Each graded episode gets a score such as 4/5 or 4.5/5. The hit rate is the sum of those scores divided by the total number of graded calls. Episodes still awaiting a grade are left out. The Points card shows the sum.
Are the strategy curves real returns?
No. Every curve, CAGR and drawdown on this page is a model, back tested figure with its as of date, shown after charges. It is not a client's actual return and not a promise of future returns. The benchmark line is drawn at the Nifty 50 TRI CAGR. How to read a back test: index investing, explained.