

Every strategy that has ever been back tested looks good in its back test. Start there. The back test is the minimum bar, not the evidence. The evidence is out of sample performance: how the strategy does on data it was not designed or tuned on.
This is the last module of Path 5, and it pulls the path together. Statistics told you how easily noise passes for signal. Time series told you markets change character. Machine learning and alternative data gave you more ways to find patterns, which means more ways to find false ones. Here are the design decisions that separate strategies likely to survive from those that will not.
Why back tests lie: the three sources of bias
Most strategies fail out of sample for three reasons that look like one problem, over fitting, but have different roots:
- In sample over fitting. Parameter tuning. Test 50 look back windows for a momentum signal and pick the best, and part of what you picked is noise. The best parameter in sample is rarely the best one afterwards.
- Back test snooping. Using the same history to build and to validate. Build on 2012 to 2022, tweak until it looks good, then "validate" on 2012 to 2022, and you have run a second in sample test with a memory.
- Survivorship bias. Testing only on stocks that survived. A database of today's Nifty 500 members leaves out every company that was delisted, merged or collapsed, so the worst outcomes vanish and returns look better than they were.
Survivorship in India: a 15 year back test on the current Nifty 500 list tests 500 companies that have already succeeded. Several large infrastructure, real estate and lending companies sat in the broad indices at their peaks, would have passed value or momentum screens, and later collapsed or were delisted. None of them is in today's list. Proper back tests use point in time index membership and include delisted stocks.
The best Sharpe in pure noise
Here is the single most useful calculation in this path. Suppose you test many strategies that have no edge at all, each over five years of data. Each one's measured Sharpe ratio is noise with a standard error of about 1 / √5 ≈ 0.45. How good does the best one look?
- 1 tried0.00
- 10 tried0.69
- 20 tried0.83
- 100 tried1.12
- 1,000 tried1.45
Expected best Sharpe ratio over a 5 year back test when no strategy has any edge. Simulation by RupeeCase: the average of the maximum of N independent standard normal draws, times 0.45. Real strategy variants are correlated, which lowers the numbers somewhat, but not the lesson.
Try a hundred variants and you should expect one to show a Sharpe above 1.1 by luck alone. That is better than most broad indices have managed over long periods. This is why the number of things you tried matters as much as the result you found, and why a back tested Sharpe needs an economic reason and an out of sample test before it means anything.
The walk forward validation framework
The only valid way to test a strategy on history is to replay the real research and deployment process: design on a training window, test on a window you have not touched, move forward in time, repeat.
- Design
Write the mechanism, choose a small set of variants, log them all.
- Tune
Pick the variant in the middle of a stable region, not the single best.
- Hold out, looked at once
The verdict. If it fails, stop; tuning here turns it into training data.
- Live data
The only fully clean test. Weigh it more per month than any back test.
Worked example: a momentum rule, from idea to hold out
Say you want a rule that holds the top 20 Nifty 100 stocks by 12 month momentum, skipping the last month, rebalanced monthly. Before touching data, you write the mechanism: investors under react to news, so trends persist for months. You also write the plan: three look backs (9, 12 and 15 months), two holding counts (20 and 30), monthly rebalancing only. Six variants, logged.
On 2010 to 2018 all six beat the Nifty 100 TRI after costs, by similar margins. That similarity is good news: the edge does not depend on one setting. You pick 12 months and 20 stocks because they sit in the middle, not because they won. On 2019 to 2022 it still beats the index, by less. On the 2023 onwards hold out it beats the index in some years and trails in others, with a deeper drawdown than the index in the weakest stretch. That is what a real, modest edge looks like out of sample. If instead the hold out had collapsed, you would stop, not tune, because tuning on the hold out turns it into training data.
Economic intuition as the first filter
Before any back test there should be an answer to one question: why should this signal predict returns? Signals with a clear mechanism are far more likely to persist than signals found by mining data.
- Momentum rests on investors under reacting to information, so news takes months to be priced in. That is a structural feature of how people process information, not a temporary anomaly.
- Quality rests on good businesses compounding capital at above average rates, and markets underestimating how long that lasts. It is tied to the economics of competitive advantage.
- A ratio found by testing 500 ratios and keeping the best has no mechanism. It found noise, and the table above shows how good noise can look.
The decision rule: a strategy earns live money when it meets all three tests: (1) a clear economic mechanism written down before the back test, (2) a satisfactory walk forward result on genuinely held out data, after costs, and (3) robustness when its parameters move within a sensible range. Two out of three is not enough.
What live data adds
Even a careful hold out is still history you could have looked at. The only fully clean test is the future. That is why the period after a rule is frozen matters so much, and why a live record, however short, deserves more weight per month than any back test.
Markets supply hard tests on their own schedule. As of 9 Oct 2026 the Nifty 50 was 14.5% below its 2 January 2026 record close, and the Nifty Smallcap 250 had fallen to a low on 23 March 2026 before rising about 24% from it (NSE index data). Any rule frozen before 2026 has now met a falling large cap market and a sharp small cap rebound it was never fitted to. That is exactly the kind of evidence to look for.
MythA long, smooth back test proves a strategy works.
FactIt proves the rule fitted the past. Without a reason, a logged search and data the rule never saw, a smooth curve is exactly what over fitting produces.
Common mistake: re optimising after a bad patch
The most damaging habit is re fitting a strategy every time it has a bad quarter. Each re fit uses the recent loss as training data, so the strategy chases the last regime and the back test gets prettier every time. After a few rounds you own a rule fitted to everything and tested on nothing.
Decide in advance how often a strategy may be reviewed, say once a year, and what evidence would justify a change: a structural reason, not a drawdown inside its historical range. Between reviews, the rule runs as written.
How this shows up in RupeeCase
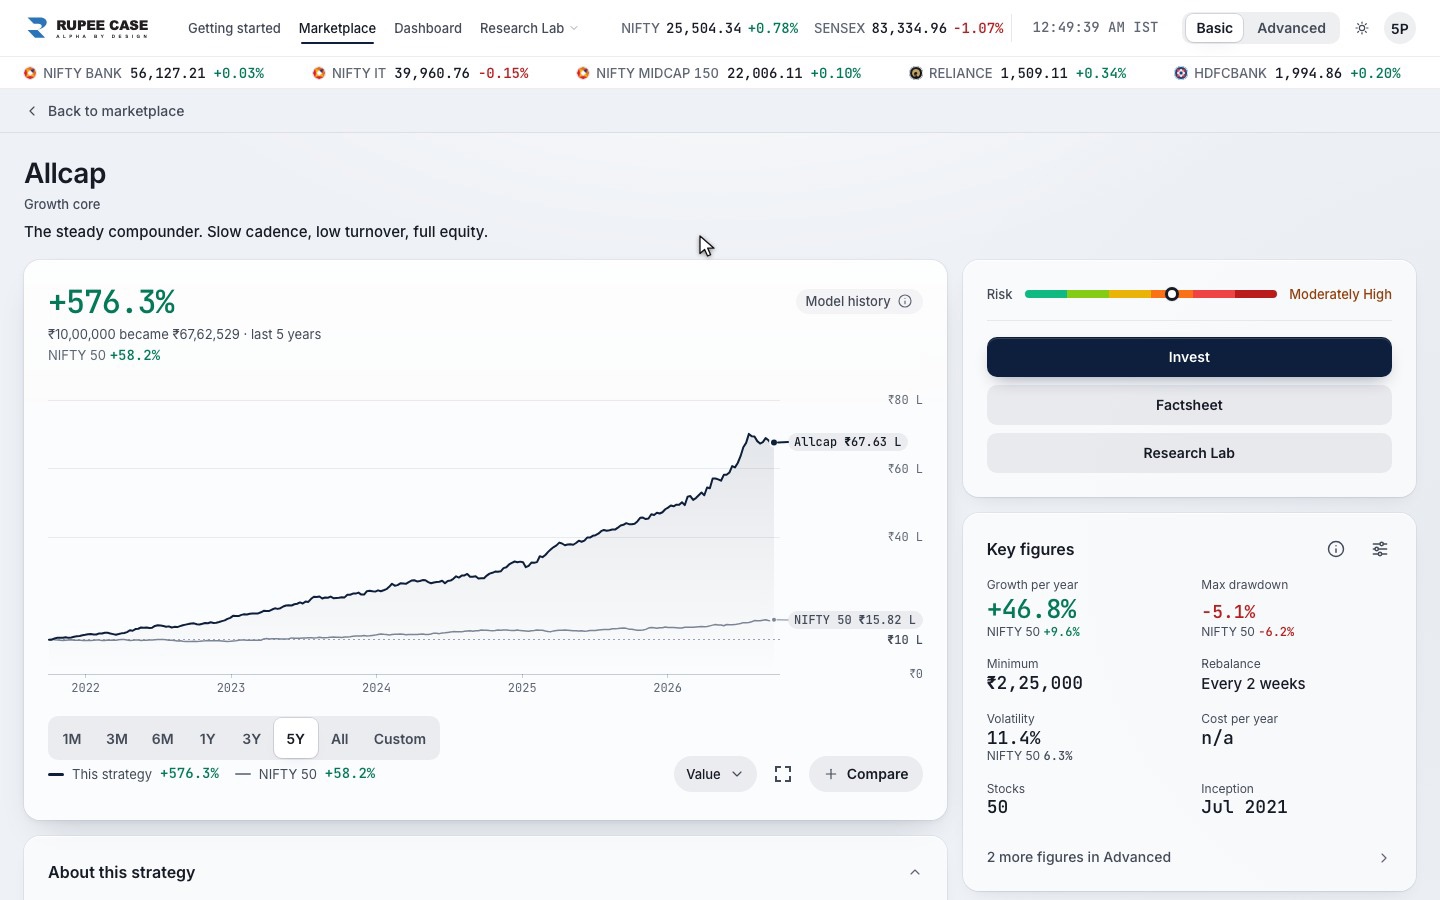
Machine learning is used in RupeeCase research to search the design of each strategy, which signals, how many names, how often to rebalance, with every candidate tested out of sample. The chosen rule is then frozen and published, so the live strategy cannot quietly re fit itself. Each factsheet states its back test window, from 9 Jul 2021, its price source, NSE BhavCopy, and the costs deducted: brokerage, STT, exchange charges and GST. Every rebalance is published on its date. All figures are model, back tested; the track record page keeps every model curve and graded call in one place, and the Allcap factsheet shows the full method.
Questions readers ask
What is the difference between in sample and out of sample?
In sample is the data used to design and tune a strategy. Out of sample is data the strategy never saw during design. Only out of sample results say anything about how a rule might behave in the future, and even they are not a promise.
How much out of sample data is enough?
As much as you can keep aside while still having enough to design on. A common split keeps the most recent 20% to 30% of the history untouched. Short hold outs give noisy answers, so combine them with economic reasoning and robustness checks.
Why do live returns usually come in below the back test?
Selection bias, costs and changing markets. The strategy you see is usually the best of several, so its back test is flattered; real trading costs more than models assume; and markets drift. A good strategy still works after that haircut.