

Strategy notes..9 min read
You sorted by return. Here is what you missed.
Re sorting the shelf by Calmar moves Midcap Smallcap from rank two to eight and Large Mid Multi Asset from ten to four, because the recovery column is the one that matters.
Model, back tested, as of 27 Apr 2026, as published then; the strategy page shows the current figure.
By Tanmay Kurtkoti, founder of QC Alpha and builder of RupeeCase
Friend forwarded a screenshot last week. Sixteen systematic strategies on a marketplace page (the lineup is 18 today), sorted by five-year CAGR, highest first. His message: "Top three look good. Which one?"
I stared at the list for maybe ten seconds before typing back: "Sort it again."
He did not know what I meant. Nobody ever does, the first time. Every screener, every comparison table, every fund factsheet opens with the same default. Return on top. The biggest number first. It is so natural that nobody questions whether the ranking is telling you the thing you actually need to know.
It is not.
The sort you learned without noticing
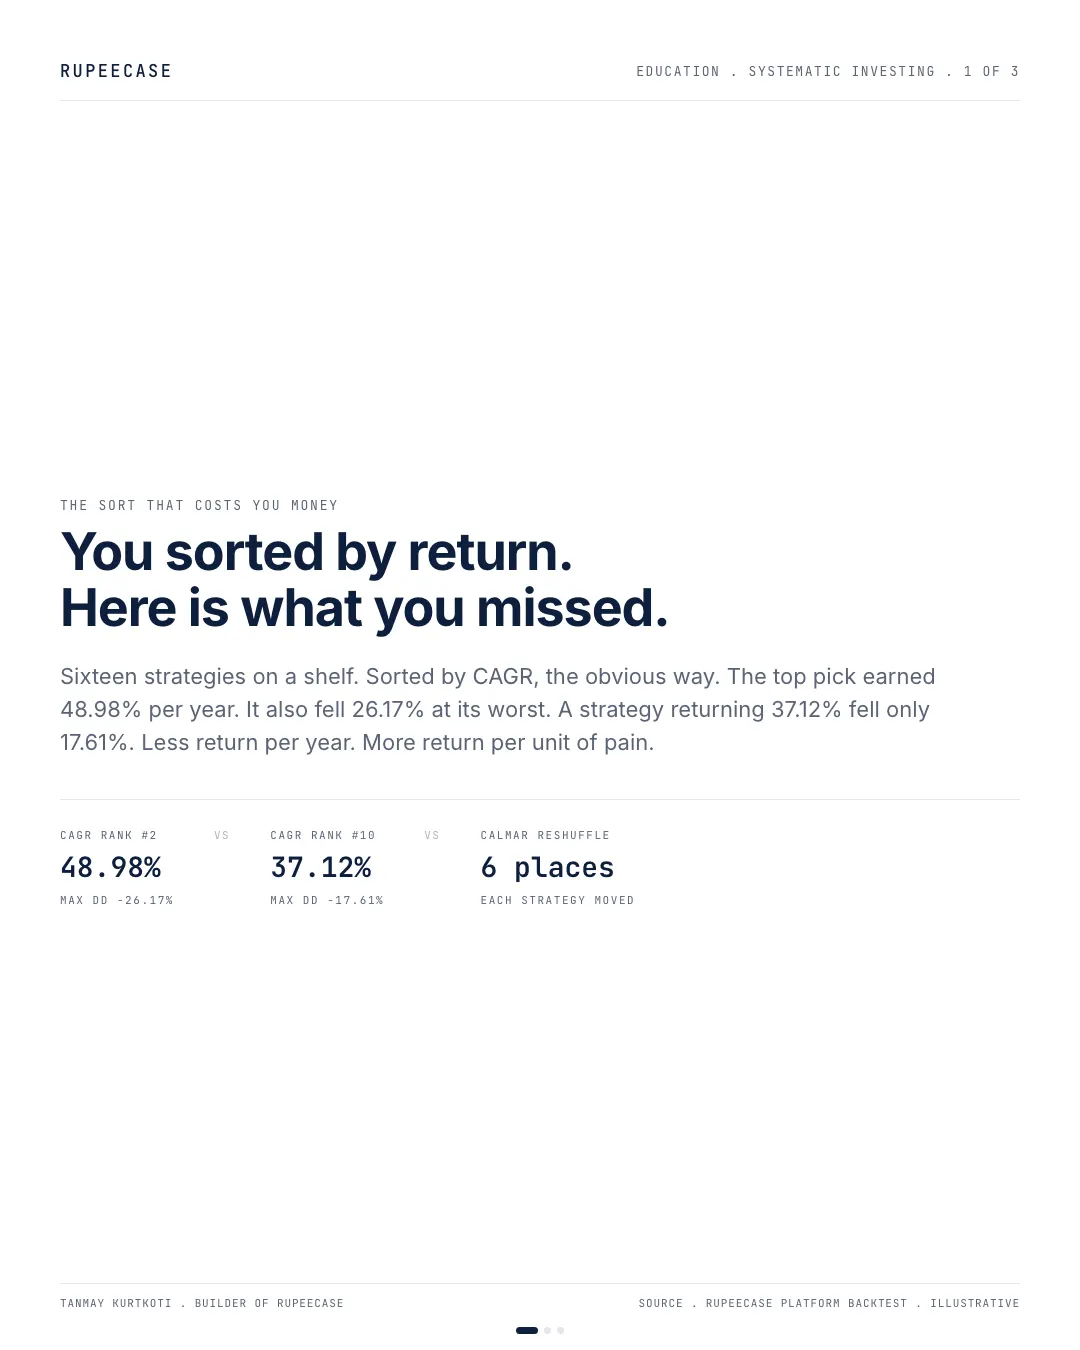
The top of that list showed a strategy returning 48.98 percent per year. Just below it, another at 48.02. Then 43.57, 42.62, 41.21. All impressive numbers. All compounding machines on paper.
Buried at rank ten was a strategy returning 37.12 percent per year. Eleven percentage points less than the leader. You would scroll right past it. Most people do.
Here is the part the screenshot did not show. The 48.98 percent strategy dropped 26.17 percent at its worst. The 37.12 percent strategy dropped 17.61 percent. That is a gap of nearly nine percentage points of pain. The second strategy earned less return per year, but it earned far more return per unit of suffering.
That ratio has a name. It is called the Calmar ratio. CAGR divided by the absolute value of maximum drawdown. And when you re-sort the same sixteen strategies by Calmar instead of CAGR, the rankings do not just shift. They scramble.
It takes two numbers from any factsheet. Try the pair from the screenshot, then any card you are looking at.
Now put in 48.98 and 26.17. The CAGR is higher, the Calmar falls to 1.87, and the climb back from the worst fall is 35.4 percent instead of 21.4.
Six strategies, two sorts, two different stories
I pulled six strategies from the shelf to make the point visible, five in the two charts and all six in the table further down. Sorted them by CAGR first, the way every screener defaults.
Midcap Smallcap leads. Energy Basket and LargeMid MA sit near the bottom. The ranking feels obvious and clean.
Now sort the same five by Calmar ratio. CAGR divided by the depth of the worst fall.
Midcap Smallcap went from first to fourth. LargeMid MA, the strategy you would have scrolled past, climbed from fourth to third, one sliver behind the joint leaders. Energy Basket collapsed from the pack to dead last, its 35.51 percent CAGR undermined by a 39.48 percent maximum drawdown that nearly wiped the return metric entirely.
Same five strategies. Same data. A different question produced a different answer.
The number the factsheet never leads with
Maximum drawdown is the peak-to-trough fall before recovery. It is the worst moment your money will have. Every factsheet carries it, but almost always below the fold, in a smaller font, after the return number has already done its work.
Here is what the falls actually look like, and what it takes to climb back.
| Strategy | CAGR | Max Drawdown | Recovery needed | Calmar |
|---|---|---|---|---|
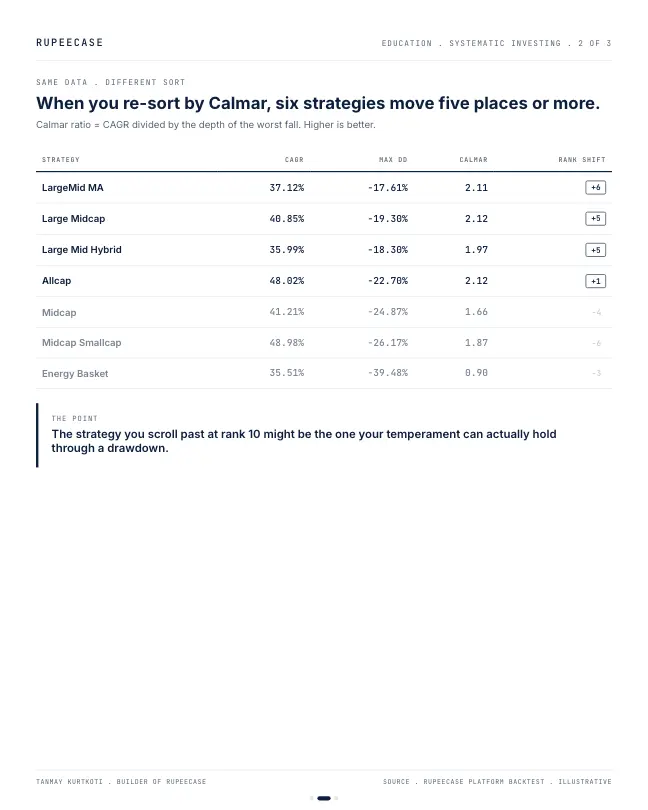
| LargeMid MA | 37.12% | -17.61% | +21.4% | 2.11 |
| Large Midcap | 40.85% | -19.30% | +23.9% | 2.12 |
| Allcap | 48.02% | -22.70% | +29.4% | 2.12 |
| Smallcap | 41.03% | -22.35% | +28.8% | 1.84 |
| Midcap Smallcap | 48.98% | -26.17% | +35.4% | 1.87 |
| Energy Basket | 35.51% | -39.48% | +65.2% | 0.90 |
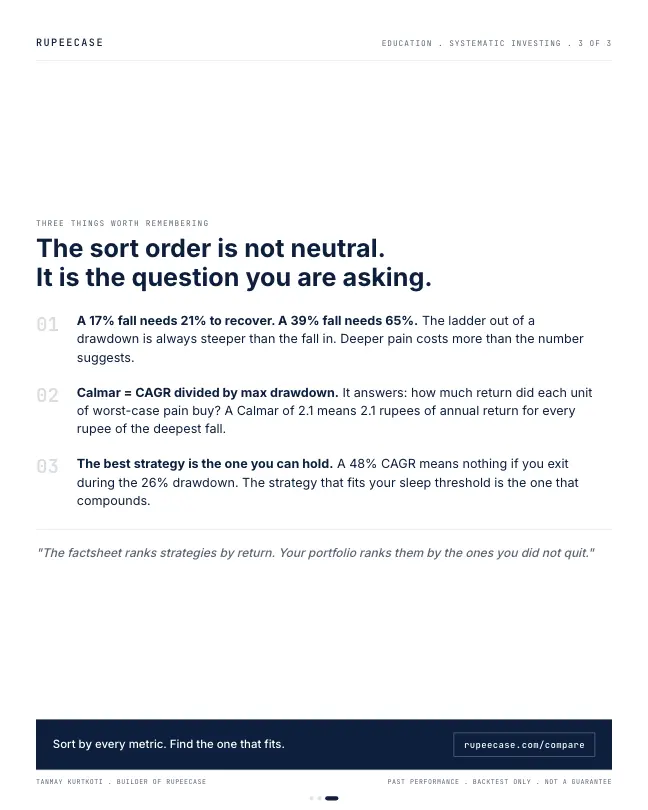
The recovery column is the part I wish more people read first. A 17.61 percent fall needs 21.4 percent to get back to zero. That is manageable. You can sit through that. A 39.48 percent fall needs 65.2 percent. That is not a recovery. That is a second bull market, and you need the entire thing just to get back to where you started.
The math is not symmetry. A 50 percent fall needs a 100 percent gain to get back to zero. The deeper the hole, the steeper the ladder out of it. And the ladder is not optional. Every rupee you lose in a drawdown is a rupee that is not compounding while you climb back.
What actually happens when the drawdown hits
Asked myself the same question I keep asking new subscribers: what would you do if you saw a quarter of your portfolio disappear?
Most people answer "hold." In theory, everyone holds. In practice, the Axis Mutual Fund study covering 2003 to 2022 measured a 5.3 percentage point annual gap between what funds earned and what investors earned. The fund's NAV compounded at 19.1 percent. The average investor's money compounded at 13.8 percent. Same fund. Same period. Nobody stole those five points. Investors timed themselves out of them, by buying after hot years and freezing during the falls.
A strategy with a shallower drawdown is not just a comfort measure. It is a retention device. The less your portfolio drops, the less likely you are to do the one thing that actually destroys returns: quit.
That is what Calmar measures, and why I keep coming back to it. Not which strategy made the most money in a vacuum, but which strategy made the most money relative to the worst thing it put you through. A Calmar of 2.11 says: for every unit of pain, you got 2.11 units of return. A Calmar of 0.90 says: the pain nearly equalled the reward. Ask yourself which one you would still be holding twelve months after the trough.
The ranking that nobody publishes
Across all sixteen strategies then on the RupeeCase marketplace, sorting by CAGR puts Midcap Smallcap at rank two. Sorting by Calmar drops it to rank eight. A six-place fall.
LargeMid Multi Asset goes the other direction. CAGR rank ten. Calmar rank four. A six-place rise. Same data, different lens, opposite conclusions about where to put your money.
Large Midcap and Large Mid Hybrid both climb five places. These are strategies with moderate CAGRs but shallow drawdowns, the kind of thing you ignore when return is the only filter and gravitate toward when you ask: how much pain did I accept for each point of gain?
MythA high Calmar ratio just means a low return with a small fall.
FactOn today's lineup the highest Calmar, 4.27, belongs to a card with the second highest CAGR, 45.18 percent, and the shallowest fall, 10.57 percent. Model, back tested, as of 27 Apr 2026.
The strategies that drop when you re-sort are the ones with deep drawdowns that the CAGR number papered over. Midcap, Microcap, Energy Basket. The returns are real. The falls are also real. The Calmar just makes both visible in a single number.
Honest version: when CAGR is the right sort
I should say this plainly. If you have the temperament to sit through a 26 percent drawdown without touching your portfolio, the CAGR sort is fine. Some people genuinely can. They have other income, long horizons, and a relationship with volatility that borders on indifference. For them, the highest-CAGR strategy will, over a full cycle, deliver the highest terminal wealth. That is just math.
The trouble is that most people overestimate their tolerance. They say "I can handle a 25 percent fall" the way someone says "I could do a marathon." Maybe. Probably not this Sunday. And certainly not when every financial headline is telling you the world is ending.
The risk profile quiz on the platform exists precisely for this reason. Twenty-eight questions that try to separate what you think you can handle from what the data says you are likely to do. The output is not a strategy recommendation. It is a temperament map that helps you read the same shelf differently.
Three things worth remembering
The CAGR number on a factsheet answers a question nobody actually lives. Nobody invests a lump sum on day one, holds through every drawdown without flinching, and exits on the last day of the backtest. Real money enters in lumps, pauses during fear, and sometimes leaves permanently.
Calmar is not the only metric that matters, but it is the one that adjusts return for the worst moment. A strategy with a high Calmar earned its return without dragging you through the deepest trench on the shelf. That matters because the trench is where most people quit.
The sort order on a screener is not a neutral choice. It is a frame. Sorting by return answers "which strategy earned the most?" Sorting by Calmar answers "which strategy earned the most per unit of the worst experience?" Both are legitimate questions. Only one of them accounts for the fact that you are a person, not a spreadsheet.
Pulled the same sixteen strategies, re-sorted them by Calmar, and sent the new screenshot back to my friend. His top three changed. Two of them were strategies he had never scrolled down far enough to see.
The compare page lets you sort by every metric on the shelf. The sort you choose is the question you are asking. Make sure it is the right one.
The same re-sort on today's 18 cards
The shelf has grown to 18 cards and the figures were refreshed to 27 Apr 2026. I ran the re-sort again. The two moves in this post repeated almost exactly: Large Mid Multi Asset goes from CAGR rank 11 to Calmar rank 5, and Midcap Smallcap from rank 4 to rank 10. Six places each way, again.
- Dynamic Asset Allocator4.27
- Focused Alpha 52.24
- Allcap1.97
- Large Midcap1.96
- Large Mid Multi Asset1.95
- Allcap Multi Asset1.90
Calmar = CAGR / absolute maximum drawdown, computed from lineup.json. Model, back tested, as of 27 Apr 2026.
Four of the six are also in the top six by CAGR, which is a reminder that the two sorts are not opposites. What the re-sort does is pull up the cards whose return came with a shallow fall, and push down the ones that needed a deep one to get there. The free Learn module on performance measurement covers Calmar alongside Sharpe and Sortino, and the note on the shallow fall follows the same shelf through calendar 2025.
Questions readers ask
What is a good Calmar ratio?
There is no fixed cut off, but the ratio is most useful for comparing strategies over the same window. On the RupeeCase lineup most cards sit between about 1 and 2, with the top card at 4.27 (Model, back tested, as of 27 Apr 2026). Above 2 means the yearly return was more than twice the worst fall.
What is the difference between the Sharpe ratio and the Calmar ratio?
Sharpe divides the return above the risk free rate by volatility, the size of the everyday swings. Calmar divides the return by the maximum drawdown, the single worst peak to trough fall. Calmar is closer to what an investor feels at the bottom.
The cards
3 cards. Swipe, or tap to open.
Explore next
Learn it properly, then see it applied.
Reading path
Stop 6 of 8 on Before you pick a card
Related
- The shallow fall compoundsSorted by max drawdown instead of CAGR, Large Mid Multi Asset's 17.61 percent hole was the shallowest in the table and its 2025, up 10.1 percent, the best in the table.Strategy notes . . 9 min
- Max drawdown is a record, not a limitThe Nifty's worst fall inside the backtest window is 16.92 percent, against about 38 percent in 2020 and 60 percent in 2008, so double the worst number you see.Strategy notes . . 5 min
- Drawdown is the KPI nobody asks aboutTwo RupeeCase cards share the same 80/10/10 recipe and differ only in universe; the narrower one gave up 6.45 points of CAGR and saved 3.74 points of drawdown.Strategy notes . . 6 min
Educational content only. Figures are illustrative and computed on historical or representative data for teaching purposes, not investment advice. Past performance does not guarantee future returns. Sourced from NSE, BSE, SEBI, AMFI and RBI public data.