

Strategy notes..6 min read
Midcap: the 41 percent and the 322 days
The Midcap card spent 322 days below its high and fell almost 24 percent in two months of 2025, and the 41 percent CAGR belonged to whoever stayed seated.
Model, back tested, as of 27 Apr 2026, as published then; the strategy page shows the current figure.
By Tanmay Kurtkoti, founder of QC Alpha and builder of RupeeCase
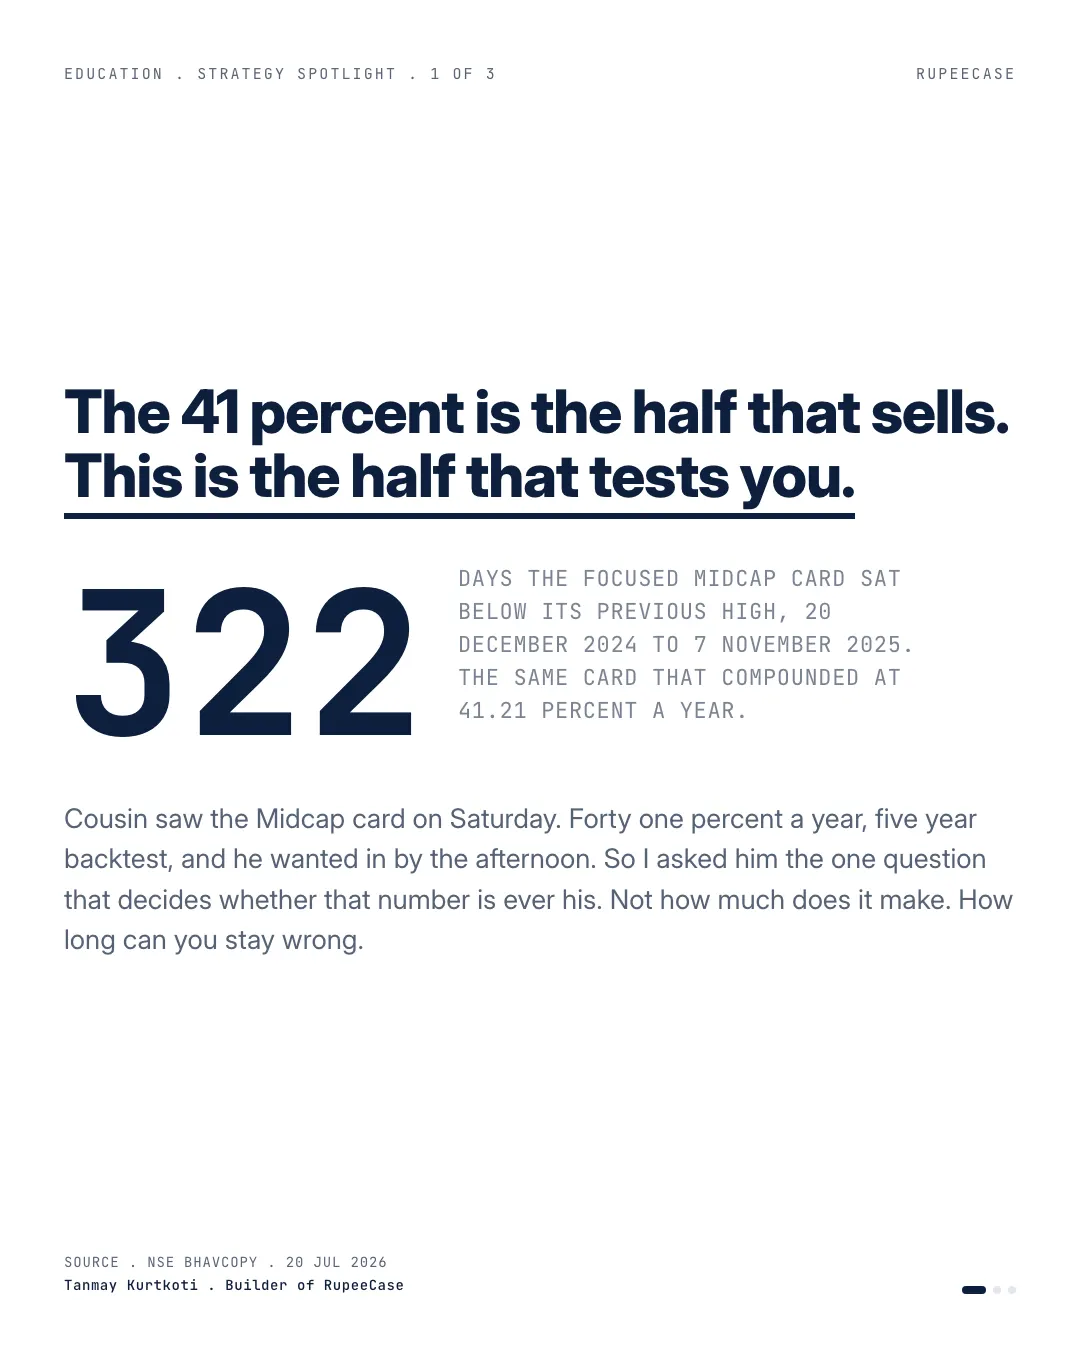
My cousin found one of our Midcap cards on Saturday. Forty one percent a year on a five year backtest. He wanted to put money in by the afternoon.
I asked him the only question that decides whether that number ever becomes his. Not how much does it make. How long can you stay wrong.
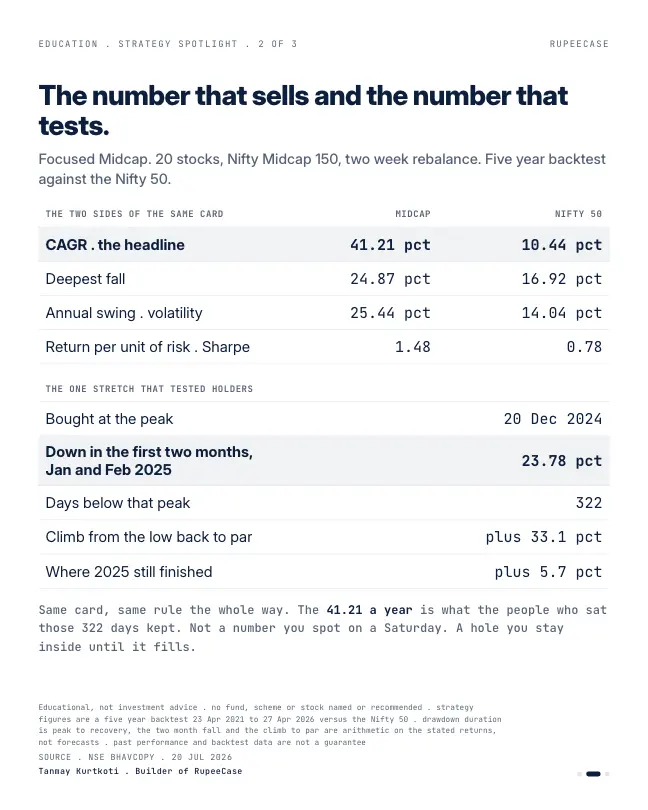
Here is why. That same card, the focused Midcap one, twenty stocks rebalanced every two weeks, spent 322 days below its previous high. From 20 December 2024 to 7 November 2025. The better part of a year staring at red. And it did not ease anyone into it. The first two months of 2025 took it down almost 24 percent before it found a floor.
Now the part nobody screenshots. Everyone who held on finished 2025 up 5.7 percent. The 41 percent was real. It was just never a reward for being clever about mid caps. It was the reward for still being in the seat when the hole filled back in.
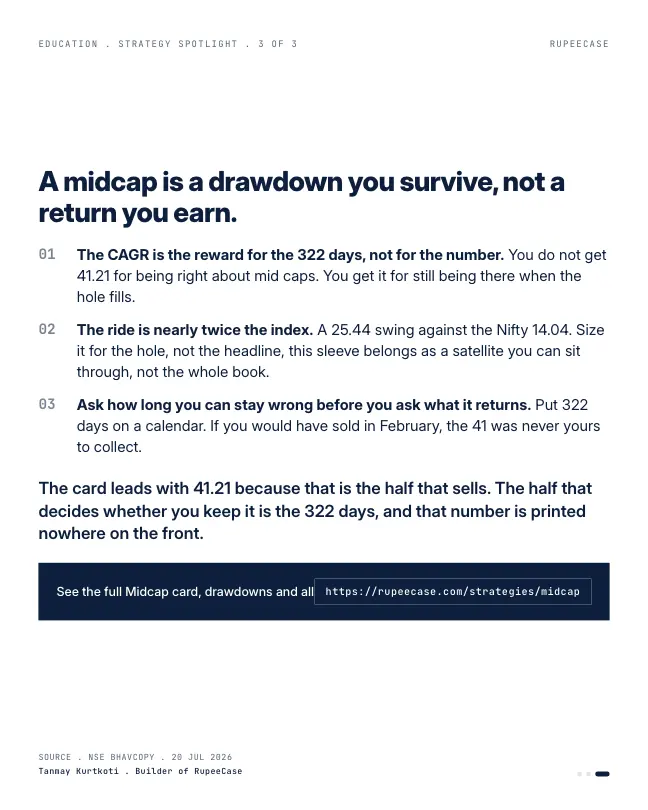
That is the whole thing with mid caps. The swing is nearly twice the index, 25.44 against the Nifty's 14.04. The number that sells you is the CAGR on the front of the card. The number that decides whether you keep any of it is the drawdown printed nowhere near it.
So before you look at what a midcap strategy returns, put its worst stretch on a calendar. 322 days. Ask yourself honestly whether you would have sold in February. If the answer is yes, the 41 was never yours to collect, and that is worth knowing before the money goes in, not after.
A drawdown has two numbers, not one
Every strategy page prints a max drawdown. Minus 24.87 percent for Midcap on the current lineup (Model, back tested, as of 27 Apr 2026). That number tells you how deep the hole was. It says nothing about how long you sat in it.
The second number is time under water: the days between the old high and the day the value closes above it again. Depth hurts once. Duration hurts every morning you open the app. Most people who quit a sound strategy do not quit at the bottom. They quit in month seven, when the fall has stopped but nothing has come back.
The index had the same shape. These are NSE daily closes, measured from each index's record close in Sep 2024.
Nifty Midcap 150 fall, 24 Sep 2024 record to 28 Feb 2025
NSE daily closes
Days until it closed above that record, on 2 Jan 2026
NSE daily closes
Nifty 50 fall, 26 Sep 2024 record to 4 Mar 2025
NSE daily closes
Days until the Nifty 50 closed above its record, on 2 Jan 2026
NSE daily closes
A deeper hole for the same wait. Both indices first closed above their records on the same day, so the Midcap 150 had to climb 26.7 percent off its low in that time against 18.7 percent for the Nifty 50. That is normal for mid caps, not bad luck. The NSE Indices factsheet of 30 Sep 2026 puts the five year volatility of the Nifty Midcap 150 at 16.86 percent against 13.82 percent for the Nifty 50.
The 2025 stretch, on a calendar
Here is the model Midcap path through that period on month end values, next to the index. Month end values smooth the daily path, so the dates differ a little from the 322 days in the opening.
- Model Midcap at a month end high
The card looks its best. This is the month most people would have found it.
- Down 23.8 percent in two months
The Nifty Midcap 150 closed at 17,750.55 on 28 Feb 2025, its low for the stretch.
- Up 27.7 percent from the floor, still under water
The hardest month to stay. Most of the climb is done and you are still below where you started.
- Model back above its Dec 2024 high
On month end values. The index is still 2 percent below its Sep 2024 record.
- 2025 ends up 5.7 percent
A flat looking year that contained a 24 percent fall.
- Index back above its record
The Nifty Midcap 150 closes above 22,493.50, its 24 Sep 2024 record, 465 days later.
<p class="vis-src">Model Midcap month end values, data/nav/midcap.json. Model, back tested, as of 27 Apr 2026. Index closes from NSE.</p>
Look at Aug 2025. The model was 27.7 percent above its February floor and still below its December high. That is the arithmetic of a drawdown working against you: a 23.8 percent fall needs a 31.2 percent gain just to get back to zero.
Do the recovery math yourself
The rule is short. Gain needed = fall / (100 minus fall). Years to recover at a steady return = ln(100 / (100 minus fall)) / ln(1 + return). Take the Midcap example.
- Fall: 23.8 percent. On Rs 10,00,000 that leaves Rs 7,62,000.
- Gain needed: 23.8 / 76.2 = 31.2 percent, or Rs 2,38,000 on Rs 7,62,000.
- At a steady 15 percent a year, that takes ln(1.312) / ln(1.15) = 1.9 years.
- The model actually did it in about eight months, Feb 2025 to Oct 2025.
Recoveries are lumpy. They often come in a few sharp months, which is exactly why the investor who sold in February and planned to "come back when it settles" usually came back late.
The full drawdown recovery calculator runs the same math for any fall. The free Learn module on risk management goes further: how to set a drawdown budget before you start, so the decision in February is already made.
The February test
Put yourself on the worst date and choose.
What would you do?
It is the end of Feb 2025. Your Midcap model portfolio is 23.8% below its Dec 2024 month end high.
- Sell and wait for calm
You lock in the 23.8% fall. By the end of Dec 2025 the model stood 38.7% above its Feb 2025 level.
- Stay with the rules
The model was back above its Dec 2024 high by the end of Oct 2025 and finished 2025 up 5.7%.
- Sell half, keep half
Half your money misses the 38.7% climb to Dec 2025, and the other half still sits through the whole wait.
Month end values, data/nav/midcap.json. Model, back tested, as of 27 Apr 2026. Not a promise of future returns.
I am not saying staying is always right. Rules can break, and a model that keeps falling for reasons you cannot explain deserves a hard look. The point is narrower: decide your drawdown limit before the money goes in, in rupees and in months, and compare it with the card's worst stretch. If the card's worst is bigger, the answer is a smaller allocation, not a braver you. The Large Midcap spotlight shows what a shallower card in the same space looks like.
Questions readers ask
How long does it take a midcap index to recover from a fall?
It varies by episode. In the most recent one, the Nifty Midcap 150 fell 21.09 percent from its record close of 22,493.50 on 24 Sep 2024 to 28 Feb 2025 and took 465 days to close above the record again, on 2 Jan 2026. The Nifty 50 fell 15.77 percent from its 26 Sep 2024 record and closed above it on the same day, 463 days later, per NSE daily closes.
What gain do I need to recover a 25 percent loss?
A 25 percent fall needs a 33.3 percent gain to get back to where you started, because the gain is earned on a smaller base. The formula is fall divided by (100 minus fall). A 50 percent fall needs a 100 percent gain.
Is max drawdown enough to judge a midcap strategy's risk?
No. Max drawdown gives the depth of the worst fall but not how long it lasted. Look at time under water too: the Midcap model fell 23.8 percent in two months of 2025 and needed until Oct 2025 on month end values to get back (Model, back tested, as of 27 Apr 2026).
The cards
3 cards. Swipe, or tap to open.
Explore next
Learn it properly, then see it applied.
Related
- Large Midcap: when the return is a tie, the drawdown decidesLarge Midcap, Smallcap and Microcap all printed about 41 percent, with holes of 19.30, 22.35 and 26.44 percent, and only the first finished 2025 up.Strategy notes . . 5 min
- Allcap: the number everyone quotes and nobody picksAllcap carried the highest Sharpe of the three momentum cards at 1.77, with the shallowest drawdown of the three, and still spent 469 days underwater.Strategy notes . . 5 min
- Focused Largecap 20: twenty sized bets on a factsheetTwenty equal weight Nifty 100 names on a four week cadence printed 27.40 percent CAGR with a 27.23 percent drawdown, and the multi asset twin nearly matched its Sharpe.Strategy notes . . 5 min
Educational content only. Figures are illustrative and computed on historical or representative data for teaching purposes, not investment advice. Past performance does not guarantee future returns. Sourced from NSE, BSE, SEBI, AMFI and RBI public data.