

Strategy notes..6 min read
Smallcap: the honest year
The RupeeCase Smallcap backtest shows four easy years and one awful one, and the 41 percent CAGR only belongs to the investor who held through 2025.
Model, back tested, as of 27 Apr 2026, as published then; the strategy page shows the current figure.
By Tanmay Kurtkoti, founder of QC Alpha and builder of RupeeCase
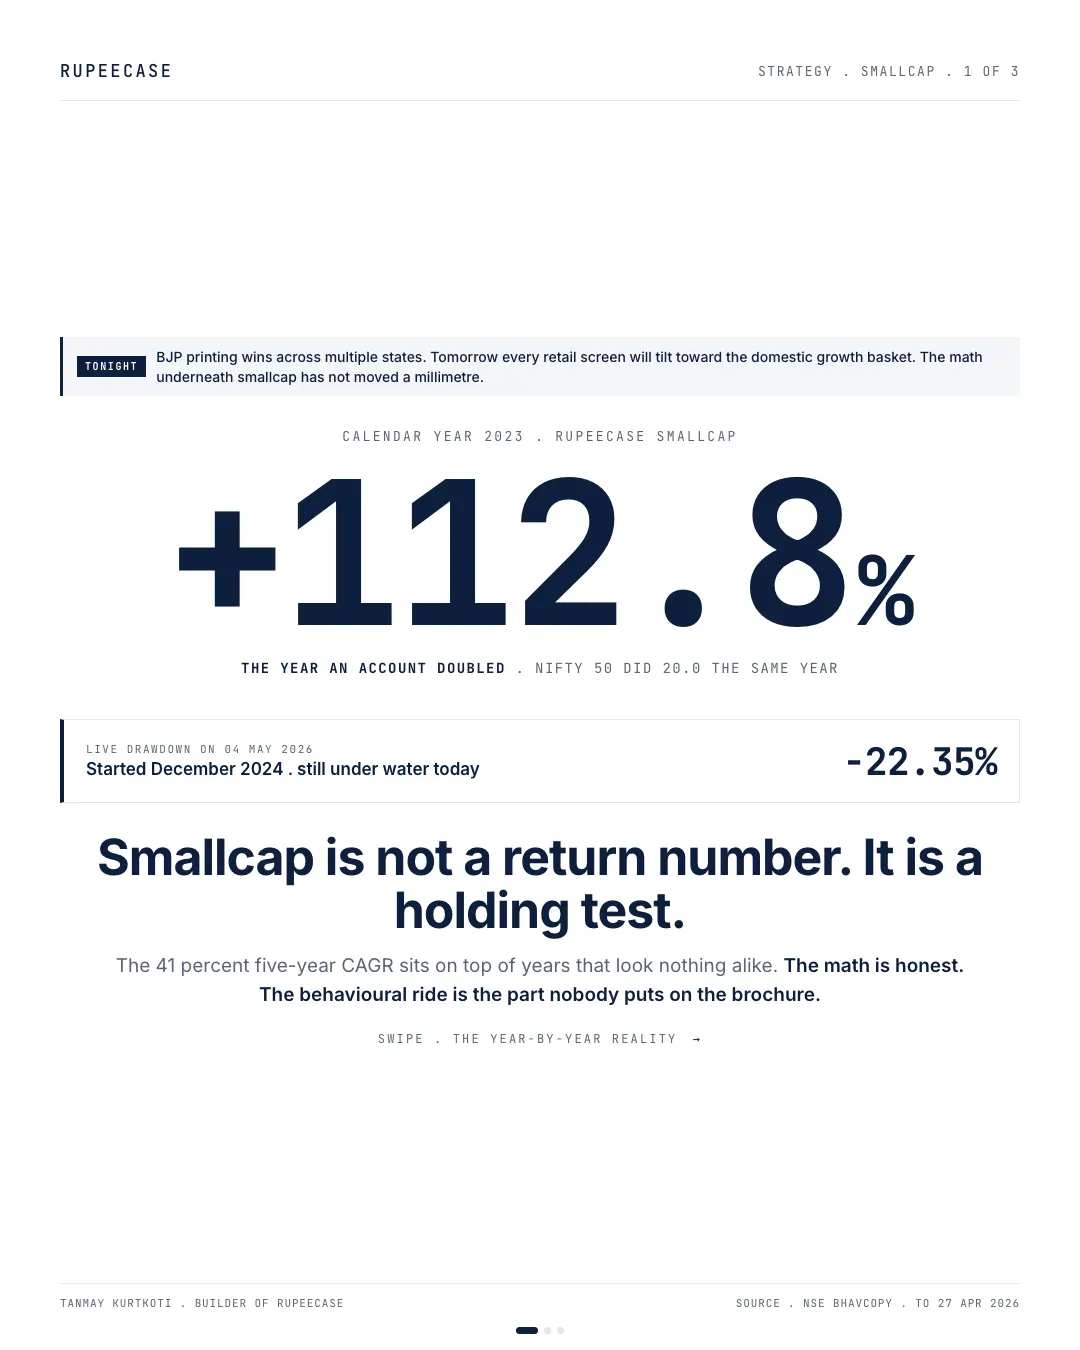
Tonight every chart show is going to talk BJP wins across states. By Tuesday open every retail screen will be tilting toward the domestic growth basket. Smallcap will be the loudest tab.
Before that noise catches you, the math underneath has not moved a millimetre.
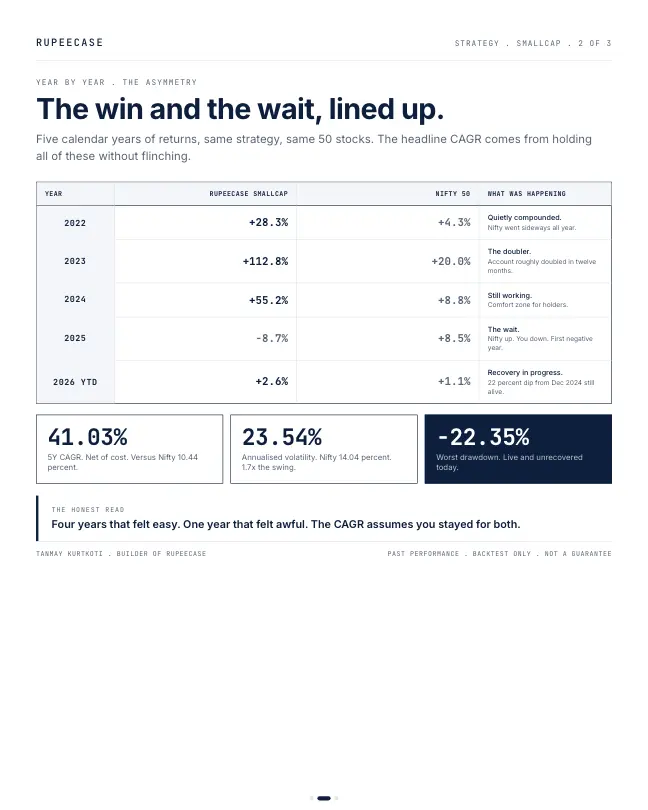
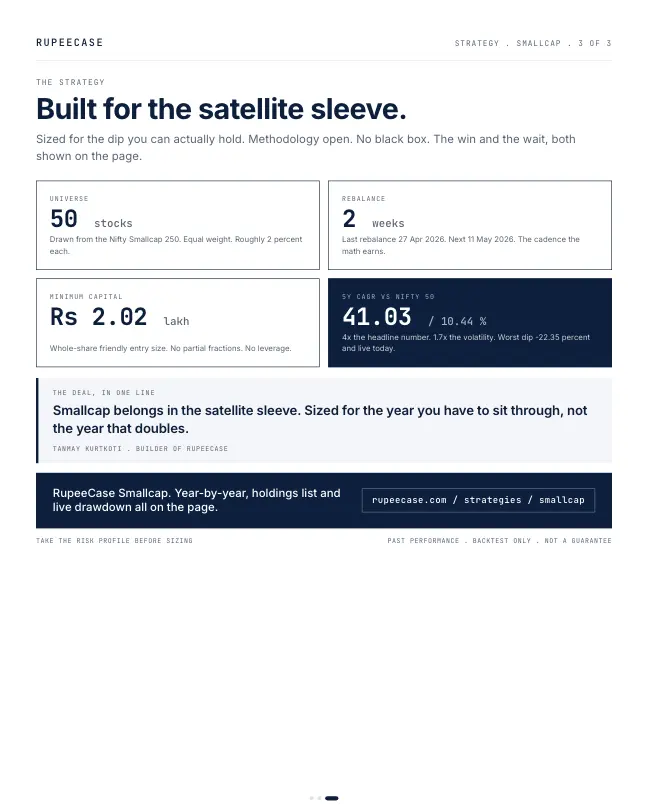
I built RupeeCase Smallcap on the Nifty Smallcap 250 universe. Fifty stocks, equal weight, fortnight rebalance. Five-year backtest CAGR sits at 41.03 percent versus 10.44 for Nifty 50 over the same window. The methodology is open at rupeecase.com/strategies/methodology
That headline is brochure language. Real money does not get held in CAGR. It gets held in calendar years.
Year by year. 2022 closed +28.3 while Nifty stalled at 4.3. Quietly compounded. 2023 +112.8 percent, the year an account doubled in twelve months. 2024 +55.2, comfort zone. 2025 closed -8.7 while Nifty 50 was up 8.5 the same year. 2026 year-to-date sits at only +2.6 because the drawdown that started December 2024 is still alive at -22.35 percent.
Four years that felt easy. One year that felt awful. The 41 percent CAGR assumes someone held all five.
Most retail investors did not hold 2025. They saw Nifty up, Smallcap down, and rotated out at the bottom. That move locks the loss in and misses the recovery. The plain-English explainer on drawdown and the behavioural cost of exit timing is at rupeecase.com/learn/
So the question is not is this strategy good. The question is can you hold it.
Smallcap belongs in the satellite sleeve, not the core. Sized for the year you have to sit through, not the year that doubles. The strategy page shows the year-by-year, the holdings list and the live -22.35 percent drawdown openly at rupeecase.com/strategies/smallcap
Before the cheque is sized, the behavioural-fit test that tells you whether you can hold through a 22 percent dip is at rupeecase.com/risk-profile
The fee-stack and side-by-side construction comparison against MF and PMS sits at rupeecase.com/compare
The math on smallcap is honest. The brochure is honest. The wait is the part nobody puts in the headline.
The card on today's file
The opening quotes the figures published on 4 May. On the current lineup file, Smallcap shows a 37.40 percent CAGR, a Sharpe ratio of 1.59 and a maximum drawdown of 22.34 percent (Model, back tested, as of 27 Apr 2026). The headline moved. The shape of the years did not.
- 202228.2%
- 2023112.7%
- 202455.2%
- 2025-8.7%
Smallcap calendar year returns. Model, back tested, RupeeCase factsheet of 13 May 2026.
Put Rs 1 lakh into the model at the end of 2021 and walk it forward. It ended 2025 near Rs 3.85 lakh and was near Rs 3.95 lakh at the end of Apr 2026, on the monthly model values. A strong result over the full stretch. Now look at how it was earned, month by month.
Monthly model returns for Smallcap from 2022, from the published nav file. The deepest red sits in Jan and Feb 2025.
Monthly returns. Model, back tested, RupeeCase Smallcap nav file, lineup as of 27 Apr 2026.
The two months that decided who stayed
On the monthly values, the model peaked at the end of Dec 2024. By the end of Feb 2025 it was 21.4 percent lower. That is close to the full maximum drawdown, delivered in eight weeks. This is the exact moment the opening describes.
What would you do?
It is the end of Feb 2025. Your Smallcap model book is 21.4 percent below its Dec 2024 peak, and the broad market looks calmer.
- Sell and move to something steadier
The 21.4 percent fall is locked in. By the end of Apr 2026 the model was 19.0 percent above its Feb 2025 level, a climb the seller did not get.
- Stay with the rules
By the end of Apr 2026 the model was 19.0 percent above the Feb 2025 level, though still about 6.5 percent below the Dec 2024 peak.
Month end values from the RupeeCase Smallcap nav file. Model, back tested, lineup as of 27 Apr 2026.
Notice the honest part of the right answer. Holding did not make the fall disappear. Fourteen months later the book was still below its old high. What holding did was keep the 19 percent climb that selling gave away. That is usually the choice: not between a loss and no loss, but between a loss you can recover from and one you made permanent.
Why selling feels right at the bottom
Behavioural finance has a name for the pull: loss aversion. Prospect theory describes how people feel a loss much more strongly than a gain of the same size. A 21 percent fall on screen feels much bigger than a 21 percent rise felt, so the urge is to make the pain stop. Selling does that. It also turns a temporary drawdown into a realised loss.
The arithmetic makes it worse. A fall needs a larger rise to recover, and the gap grows with the depth of the fall.
A 21.4 percent fall needs a 27.2 percent rise. A 30 percent fall needs 42.9. Someone who sells at the bottom and buys back later has to catch that whole climb on the way up, and usually buys back after a good part of it has happened.
MythSelling after a fall protects you from the rest of it.
FactIt also locks in the fall and gives up the climb. From Feb 2025 to Apr 2026 the Smallcap model rose 19.0 percent (Model, back tested).
Sizing for the year you have to sit through
The opening's rule, satellite and not core, is a sizing rule. Decide the fall you can sit through on the whole book, then work backward. If a Smallcap sleeve can fall about 22 percent, a 25 percent sleeve adds about 5.5 points to the whole book's fall; a 60 percent sleeve adds about 13. The factsheet's other risk lines help with the same decision: annualised volatility of 23.51 percent and a worst single week of minus 9.84 percent (Model, back tested, risk metrics as of 27 Apr 2026).
The free Learn module on loss aversion and prospect theory shows how the pull to sell at the bottom works and how rules counter it, with a quiz. The drawdown recovery calculator works out the climb back from any fall. Related: drawdown is the KPI nobody asks about and Large Midcap, when the return is a tie.
Questions readers ask
Why do small cap strategies have bad years even when the market is up?
Small companies tend to fall harder and together when investors turn cautious, even in a year when large caps hold up. In 2025 the Smallcap model card fell 8.7 percent for the calendar year, after three strong years (Model, back tested). A strong long run figure averages good and bad years; it does not remove the bad ones.
What is loss aversion in investing?
It is the tendency to feel a loss more strongly than a gain of the same size, one of the central findings of prospect theory. It pushes investors to sell after a fall to stop the pain, which turns a temporary drawdown into a permanent loss.
How much does a portfolio need to rise to recover a 20 percent fall?
25 percent. A fall of f needs a rise of 1 divided by (1 minus f), minus 1. A 21.4 percent fall needs 27.2 percent, a 30 percent fall needs 42.9 percent and a 50 percent fall needs 100 percent.
The cards
3 cards. Swipe, or tap to open.
Explore next
Learn it properly, then see it applied.
- Free module 3.1The Momentum Factor11 min read
- CalculatorLump sum vs SIPFree, with the formula and a worked example
- Free module 8.2Loss Aversion and Prospect Theory11 min read
- CalculatorDrawdown and recoveryFree, with the formula and a worked example
- StrategySmallcap strategyNifty Smallcap 250, 50 stocks, every 2 weeks
- Blog topicStrategy notes notes22 notes
Related
- Large Midcap: when the return is a tie, the drawdown decidesLarge Midcap, Smallcap and Microcap all printed about 41 percent, with holes of 19.30, 22.35 and 26.44 percent, and only the first finished 2025 up.Strategy notes . . 5 min
- Sharpe ratio, decoded on a live cardAllcap Multi Asset earned 4.1 times the Nifty's CAGR for 1.5 times its volatility, which is what a Sharpe of 1.79 against 0.79 means in plain numbers.Strategy notes . . 5 min
- The cadence question: why two weeksRupeeCase Large Midcap rebalanced 131 times in five years at a 14 day average gap, a cadence chosen to stop a momentum signal rotting without paying quarterly latency.Strategy notes . . 5 min
Educational content only. Figures are illustrative and computed on historical or representative data for teaching purposes, not investment advice. Past performance does not guarantee future returns. Sourced from NSE, BSE, SEBI, AMFI and RBI public data.