

Strategy notes..9 min read
The shallow fall compounds
Sorted by max drawdown instead of CAGR, Large Mid Multi Asset's 17.61 percent hole was the shallowest in the table and its 2025, up 10.1 percent, the best in the table.
Model, back tested, as of 27 Apr 2026, as published then; the strategy page shows the current figure.
By Tanmay Kurtkoti, founder of QC Alpha and builder of RupeeCase
Sunday evening my father pulls up a comparison table on his phone. Eleven strategies side by side, sorted by five year CAGR, highest first. He points to the one at the top. "This is the one to own." I ask him to sort it the other way. By max drawdown. Shallowest first.
He looked at me like I had asked him to drive in reverse.
The strategy that fell the least had the best 2025 in the table, up 10.1 percent. Most of the others were red.
A fall and its recovery are not the same size
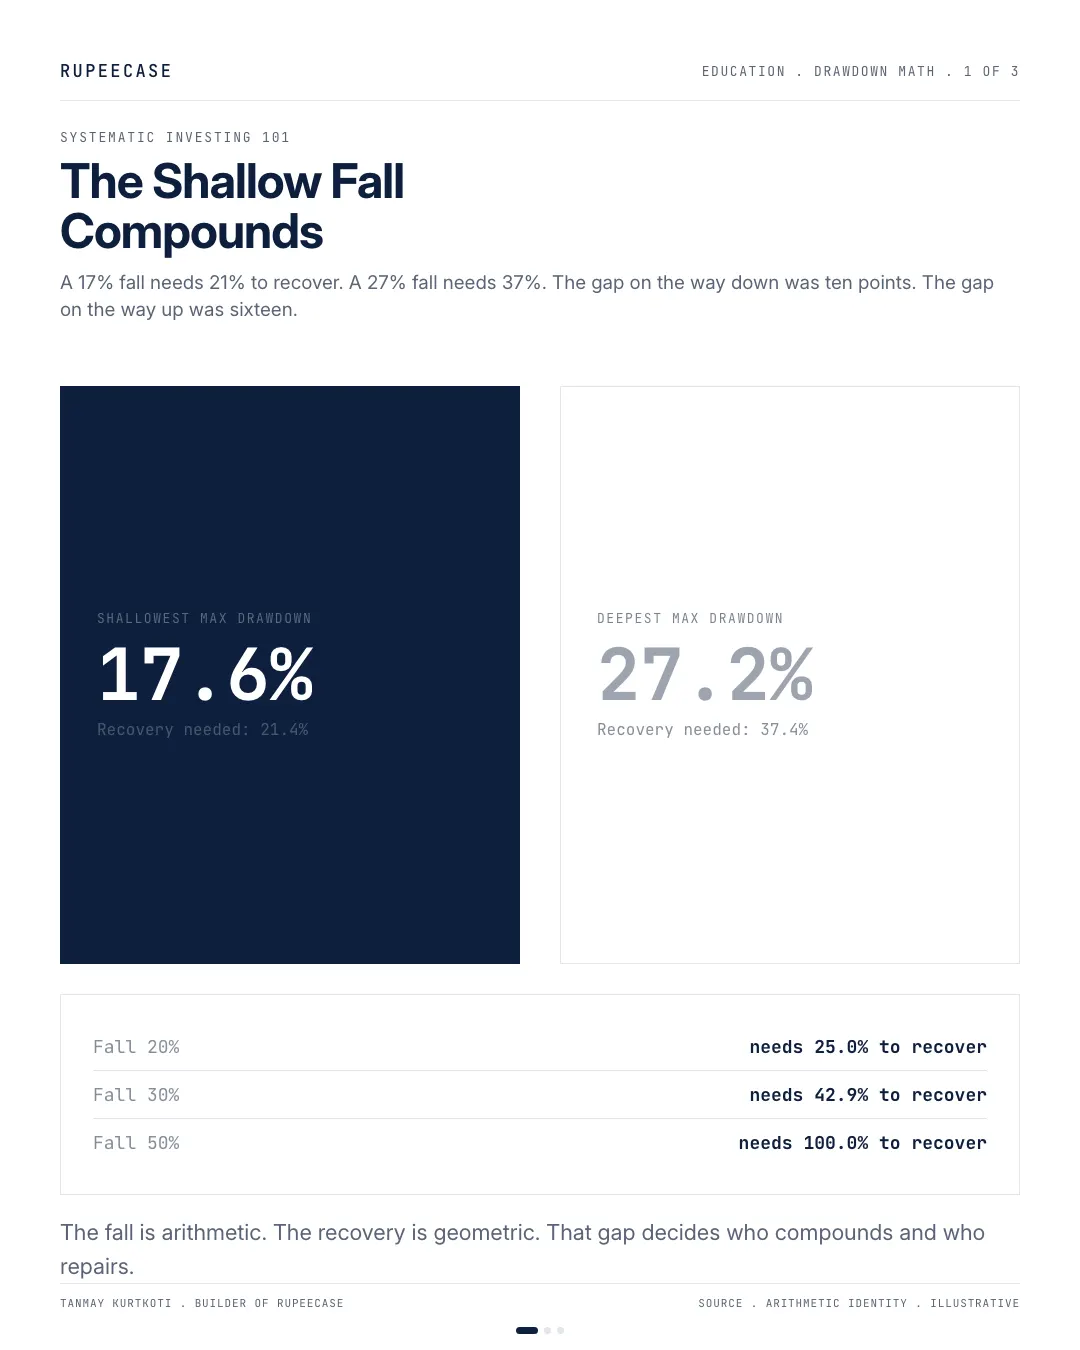
This is the part that tricks people. A 20 percent fall does not need a 20 percent rise to get back. It needs 25 percent. A 30 percent fall needs 42.9 percent. A 50 percent fall needs the market to double, a full 100 percent, just to stand where it was.
The relationship is not linear. It is a curve that gets steeper as you go deeper, and it gets steep fast.
One strategy falls 17.6 percent. Another falls 27.2 percent. Gap on the way down: about ten points. On the way back up, the shallow one needs 21.4 percent. The deep one needs 37.4 percent. A 16 point gap in the climb. The fall was roughly equal. The recovery cost was not even close.
The repair has a time cost as well as a size. At any given growth rate, a deeper hole takes longer to climb out of, and the gap grows faster than the fall.
At 20 percent a year, the 17.6 percent fall is repaired in about 13 months. The 27.2 percent fall takes about 21. Eight extra months of feeling wrong, from ten points of extra depth.
Eleven strategies, sorted the wrong way
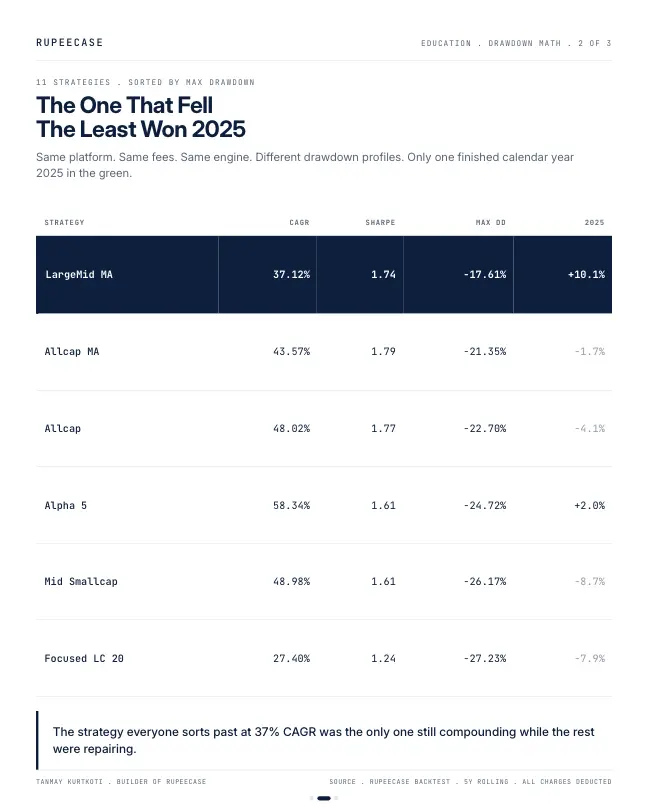
I ran the comparison across the RupeeCase marketplace. Eleven strategies, same platform, same fee structure, same rebalance engine, different universes and different risk profiles. Most people sort by CAGR. Here is what happens when you sort by max drawdown instead.
| Strategy | CAGR | Sharpe | Max DD | 2025 Return |
|---|---|---|---|---|
| LargeMid Multi Asset | 37.12% | 1.74 | -17.61% | +10.1% |
| Allcap Multi Asset | 43.57% | 1.79 | -21.35% | -1.7% |
| Allcap | 48.02% | 1.77 | -22.70% | -4.1% |
| LargeCap Multi Asset | 25.03% | 1.28 | -23.23% | -3.1% |
| Alpha 5 | 58.34% | 1.61 | -24.72% | +2.0% |
| Midcap | 41.21% | 1.48 | -24.87% | +5.7% |
| Mid Smallcap | 48.98% | 1.61 | -26.17% | -8.7% |
| Focused Largecap 20 | 27.40% | 1.24 | -27.23% | -7.9% |
The one with the shallowest max drawdown, 17.61 percent, also had the best calendar year 2025 in the table, up 10.1 percent. Not by a rounding error. More than four points clear of the next best, Midcap at 5.7, while five of the eight shown were negative.
The strategy with the highest CAGR, Alpha 5 at 58.34 percent, fell 24.72 percent at its worst and barely scraped positive in 2025. The one most people would scroll past, the 37 percent CAGR, held its line and kept compounding while the rest were still recovering.
The year that proved the point
2025 was a correction year. Not a crash. A slow grind that started in late September 2024 and has not fully recovered for some of the aggressive strategies even now.
Three bars to the right, seven to the left, and the longest bar on the right belongs to the shallowest fall. That is not a statistical coincidence. The strategy that drew down the least had the least to recover and got back to compounding first while the rest were still climbing out of their holes.
What sits under the hood
Forty momentum stocks from the Nifty LargeMidCap 250 universe, each at roughly 2 percent weight. Equal weight, no concentration. Rebalanced every two weeks. The equity sleeve is 80 percent. The other 20 percent sits in two buffers: 10 percent liquid debt, 10 percent gold.
Same 80/10/10 framework as its twin, the Allcap Multi Asset, which runs on the broader Total Market universe. Same overlay, narrower stock pool. You give up about 6.5 points of CAGR (37.12 vs 43.57) and gain nearly four points of shallower drawdown (17.61 vs 21.35). Calmar ratio 2.11. Sharpe 1.74. Win rate 64.75 percent, highest in the marketplace.
The debt and gold sleeves are not decoration. In a correction, equity falls, gold tends to hold, debt stays flat. The rebalance engine sells what rose and buys what fell, every two weeks. Mechanical mean reversion across asset classes, not a timing call.
The honest part nobody puts in the brochure
Here is where I have to be straight.
In a sustained bull run, this strategy will trail. It has to. Twenty percent of the capital sits in non equity instruments earning far less than a ripping stock market. Calendar year 2024 it returned 42 percent, strong, but the pure equity strategies did 30 to 60.
And 17.61 percent is still a real fall. On a Rs 10 lakh portfolio that is Rs 1.76 lakh of paper loss. It sat in drawdown for 350 days on its worst stretch. Nearly a year underwater.
The CAGR gap is real too. Rs 10 lakh at 37.12 percent compounds to about Rs 48.5 lakh over five years. At 48.02 percent, the same capital reaches Rs 71.1 lakh. That is Rs 22.6 lakh more. Lower ceiling for a shallower floor. If you can sit through the full cycle without panicking, the higher CAGR strategy wins on absolute return. The question is whether you can actually sit through it.
The part the spreadsheet does not capture
A deeper drawdown is not just a bigger number. It is a longer period of feeling wrong, opening the portfolio to red for six months while the news says the correction is not over.
People do not hold through drawdowns by reading Sharpe ratios. They hold by not feeling like the ground has disappeared. A 17.6 percent fall feels like a bad quarter. A 27 percent fall feels like a mistake. The math is in the recovery table. The behaviour is in whether you are still in the seat when the recovery starts.
The shallow strategy recovers first. While the deep one is still climbing back to its starting point, the shallow one has already resumed compounding on top of a higher base. That gap opens quietly and it does not close.
Three things to check before you sort by CAGR
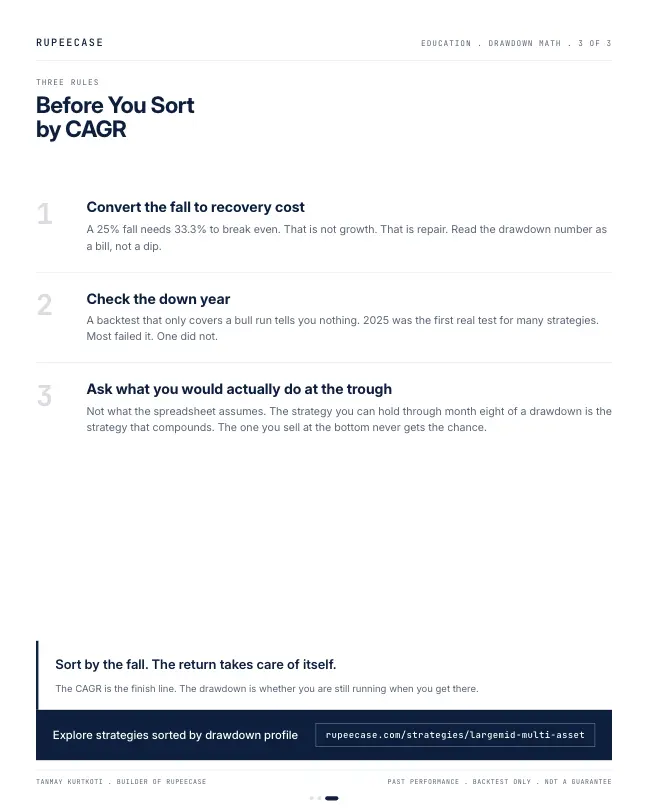
One. Convert the max drawdown to recovery needed. A 25 percent fall needs 33.3 percent just to stand where it was. That is not growth. That is repair.
Two. Check whether the strategy survived a real down year. 2025 was the first real test for many of these strategies, and most failed it. The shallowest one passed it best.
Three. Ask yourself what you would actually do at the trough. Not what the spreadsheet assumes. What you would do at month eight, when the one you chose is down 25 percent and the one you passed on is down 17. The risk profile quiz can help you find that honest answer. The strategy you can hold is the strategy that compounds.
The CAGR number is the finish line. The drawdown number is whether you are still running when you get there. I would rather own the one I can hold through a bad year than the one that looks better in a table I will never sit still long enough to collect on.
Sort by the fall. The return takes care of itself.
The same test on today's lineup
The lineup has grown since this was written, to 18 cards, and the figures have been refreshed. The pattern held. Sort the current shelf by the depth of its worst fall and take the six shallowest.
- Dynamic Asset Allocator-10.57%
- Nifty 50 Equal Weight-15.71%
- Large Mid Multi Asset-17.60%
- Large Mid Hybrid-18.27%
- Large Midcap-19.31%
- Large Cap Multi Asset-20.96%
Maximum drawdown. Model, back tested, as of 27 Apr 2026. RupeeCase lineup.json.
All six finished calendar 2025 up on their month end model values: 18.5, 11.6, 10.2, 7.3, 7.5 and 0.6 percent in that order. Across the whole shelf only eight of the eighteen did.
Cards that finished 2025 up
Month end values. Model, back tested, as of 27 Apr 2026
Of the six shallowest falls that did
Month end values. Model, back tested, as of 27 Apr 2026
Large Mid Multi Asset now shows 34.33 percent CAGR, a maximum drawdown of 17.60 percent and a Sharpe of 1.72 (Model, back tested, as of 27 Apr 2026). It is no longer the shallowest fall on the shelf. The lesson did not depend on which card holds that spot. The free Learn module on risk metrics that matter covers drawdown, recovery and the ratios built on them, and the note on sorting by return runs the same shelf through the Calmar ratio.
Questions readers ask
How much does a portfolio need to gain to recover from a 20 percent fall?
It needs 25 percent, because the gain is earned on the smaller amount left after the fall. A 30 percent fall needs about 42.9 percent and a 50 percent fall needs 100 percent.
Why does a smaller drawdown lead to better long term compounding?
A shallower fall needs a smaller rise to repair, so the portfolio gets back to its old peak sooner and starts compounding from a higher base. It also makes it more likely that the investor stays in through the trough.
The cards
3 cards. Swipe, or tap to open.
Explore next
Learn it properly, then see it applied.
Reading path
Stop 7 of 8 on Before you pick a card
Related
- You sorted by return. Here is what you missed.Re sorting the shelf by Calmar moves Midcap Smallcap from rank two to eight and Large Mid Multi Asset from ten to four, because the recovery column is the one that matters.Strategy notes . . 9 min
- Large Mid Multi Asset: the card that finished 2025 greenIt closed 2025 up 10.1 percent while the broad cards fell, giving up 6.45 points of CAGR for a 17.61 percent worst hole and the highest win rate.Strategy notes . . 5 min
- Drawdown is the KPI nobody asks aboutTwo RupeeCase cards share the same 80/10/10 recipe and differ only in universe; the narrower one gave up 6.45 points of CAGR and saved 3.74 points of drawdown.Strategy notes . . 6 min
Educational content only. Figures are illustrative and computed on historical or representative data for teaching purposes, not investment advice. Past performance does not guarantee future returns. Sourced from NSE, BSE, SEBI, AMFI and RBI public data.