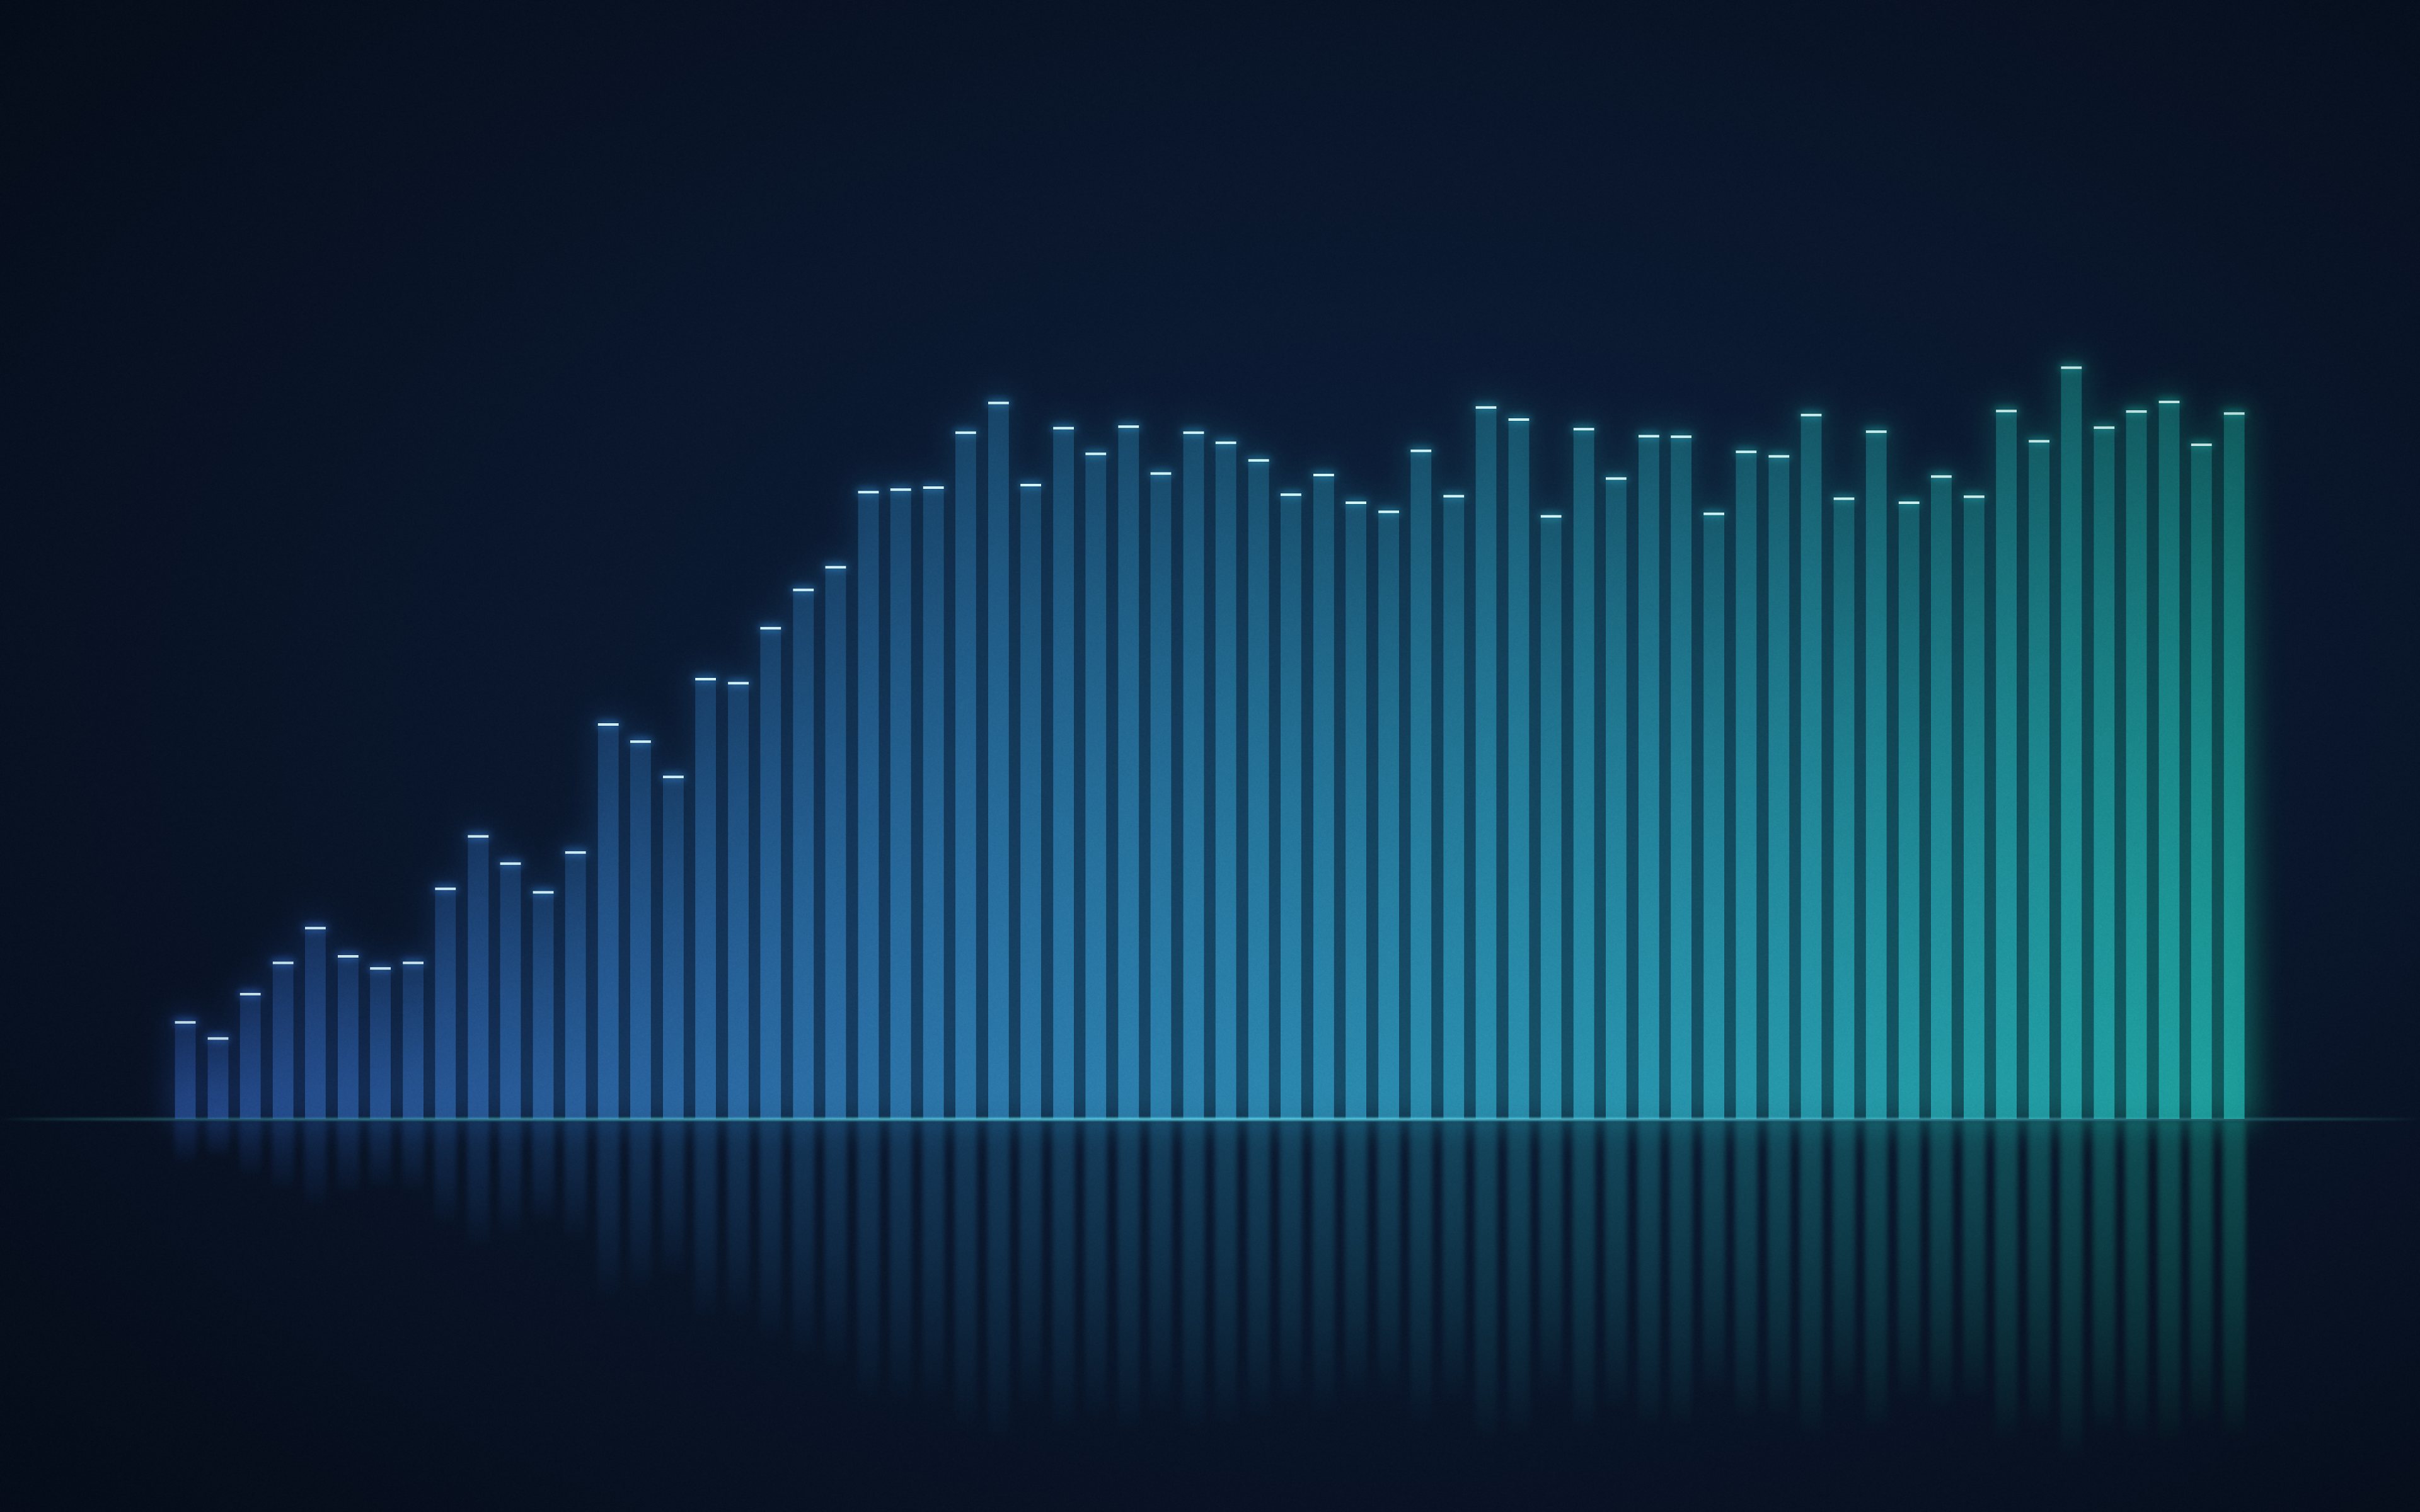
₹100 in the model in May 2021 became ₹534 by Jul 2026; the Nifty 50 TRI line reached ₹162. Model, back tested. As of 27 Apr 2026. After charges, log scale. Not a promise of future returns.
02Three steps
Compare. Validate. Invest.
1
Compare
Line Microcap up against the other 17 strategies, and against funds, PMS and AIF.
Microcap, momentum strategy. 50 stocks from the Nifty Microcap 250. The deepest cap-curve card on the lineup.
CAGR 37.33%, max drawdown −26.43%, Sharpe 1.52: Model, back tested. As of 27 Apr 2026. Minimum about ₹2,25,000. Fee 0.2% of traded value per rebalance. Moderately High risk band.
Performance
Calendar year returns
2021from May+42.1%
2022+17.9%
2023+92.8%
2024+67.7%
2025−7.3%
2026to May+8.1%
Model, back tested, after charges, 2021 to May 2026. Not a promise of future returns.
What an amount would have become
You put in
₹2,25,000
Model value
Gain
Model, back tested: the published monthly model returns after charges, May 2021 to May 2026 (61 months). A back test, not a promise of future returns.
Stress test: drag through the falls
Move across the record to read how far the model sat below its last peak, and how long it took to climb back.
MonthFeb 2025
Below the last peak−25.3%
Back to the peak
Model value, log scaleBelow the last peak
20222023202420252026
Deepest falls, daily record
Model, back tested. As of 27 Apr 2026. The scrub reads month end model values from May 2021 to Jul 2026, so its falls read shallower than the daily figures on the buttons; days are counted between month ends. Drawdowns of similar size can happen again. Moderately High risk band.
Monthly returns
Microcap: monthly model returns, percent, after charges
Year
Jan
Feb
Mar
Apr
May
Jun
Jul
Aug
Sep
Oct
Nov
Dec
Year
2021
Janno data
Febno data
Marno data
Aprno data
May1.9
Jun9.8
Jul13.8
Aug−6.4
Sep4.9
Oct2.9
Nov−1.7
Dec12.5
Year+42.1%
2022
Jan1.1
Feb−10.7
Mar7.3
Apr7.1
May−7.5
Jun−1.9
Jul10.8
Aug3.7
Sep−1.5
Oct3.3
Nov4.5
Dec2.6
Year+17.9%
2023
Jan−5.6
Feb0.4
Mar2.7
Apr6.9
May8.2
Jun9.1
Jul13.6
Aug7.4
Sep3.6
Oct3.4
Nov13.3
Dec6.1
Year+92.8%
2024
Jan12.5
Feb1.3
Mar−2.7
Apr10.7
May2.4
Jun10.4
Jul5.1
Aug4.1
Sep6.4
Oct−3.4
Nov9.5
Dec−1.8
Year+67.7%
2025
Jan−12.3
Feb−13.3
Mar9.8
Apr0.5
May8.8
Jun2.7
Jul−0.3
Aug−0.7
Sep−0.4
Oct4.3
Nov0.0
Dec−3.9
Year−7.3%
2026
Jan−5.5
Feb4.3
Mar−8.7
Apr17.8
May1.9
Junno data
Julno data
Augno data
Sepno data
Octno data
Novno data
Decno data
Year to date+8.1%
Model, back tested, after charges. Each cell is one calendar month, in percent. Not a promise of future returns.
Rolling returns
Any 1 year
Worst
−7.3%
Median
+23.9%
Best
+132.1%
Positive
90%of 51 windows
Return over each 12 month window.
Any 3 years
Worst
+32.4%
Median
+49.1%
Best
+63.6%
Positive
100%of 27 windows
CAGR over each 36 month window.
Model, back tested, from the month end model values, May 2021 to Jul 2026. Not a promise of future returns.
Deepest falls
−18.92%21 Jan 2022 to 19 Aug 2022210 days
−12.60%6 Aug 2021 to 24 Sep 202149 days
−10.90%9 Feb 2024 to 29 Mar 202449 days
−8.24%22 Oct 2021 to 3 Dec 202142 days
−6.74%20 Jan 2023 to 7 Apr 202377 days
Model, back tested, daily record over rolling 5 years: from the peak to the low, and the days until the record was back at that peak.
Weights on the rebalance day, 11 May 2026; they drift with prices until the next rebalance. Model portfolio, not a recommendation to buy or sell any stock.
Sector allocation
Other, not yet mapped40.3%
Capital Goods14.7%
FMCG & Consumer12.6%
Chemicals8.2%
Power & Utilities6.0%
IT & Technology4.4%
Banking & Financial4.4%
Auto & Components3.5%
Realty & Construction2.3%
Metals & Mining2.2%
Pharma & Healthcare1.5%
11 sectors in the equity sleeve; the largest mapped sector is Capital Goods at 14.7%, and 40.3% of the sleeve is not yet in the sector map. Pure microcap spectrum with diverse holdings across multiple smaller cap segments. Sector map curated against NSE listings.
Sector weight by year
Average sector weight of the equity sleeve in each year, percent, and the weight on the latest published list
Sector
2021
2022
2023
2024
2025
2026
Now
Other, not yet mapped
83
80
80
77
77
54
40
Capital Goods
3
3
3
4
3
7
15
FMCG & Consumer
3
3
3
5
6
10
13
Chemicals
1
1
1
2
2
5
8
Power & Utilities
5
3
2
3
2
3
6
Auto & Components
0
2
2
2
3
6
4
IT & Technology
2
2
1
1
2
4
4
Banking & Financial
0
1
1
0
0
2
4
Metals & Mining
2
2
4
3
2
3
2
Pharma & Healthcare
1
1
2
3
2
4
2
Realty & Construction
0
0
0
0
0
0
2
Energy & Oil & Gas
0
1
0
0
0
2
out
132 published rebalances, 12 sectors touched, 11 held on the latest list (11 May 2026). Each cell is the average weight that year, equal weighted at the stock level; darker is a higher weight.
Rebalances
The rebalance record
published rebalances
132
first in the record
14 May 2021
26 a year
Every 2 weeks
latest published
11 May 2026
Rebalances run on a fixed calendar; you approve each one before your broker places the orders.
Latest rebalance, 11 May 2026
Against the list of 8 May 2026: 0 in, 18 out, 48 held, 48 on the list.
Out
KSB
THANGAMAYL
OSWALPUMPS
AWFIS
IMFA
WAAREERTL
RTNINDIA
GAEL
SHRIPISTON
GOKEX
MAHSEAMLES
ASTRAMICRO
ALIVUS
LUMAXTECH
KRBL
STAR
EPL
AKUMS
Held
STLTECH
WEBELSOLAR
CUPID
QPOWER
APOLLO
JAYNECOIND
HCC
TDPOWERSYS
KRN
AZAD
KIRLPNU
BALAMINES
JAIBALAJI
SKYGOLD
SKIPPER
LLOYDSENT
PTC
LLOYDSENGG
DIACABS
GOKULAGRO
ASHAPURMIN
MIDHANI
AVANTIFEED
EIEL
SANSERA
INOXINDIA
PFOCUS
PRAJIND
KTKBANK
POWERMECH
PARAS
ANUP
AETHER
OPTIEMUS
PRUDENT
TIPSMUSIC
TMB
EMIL
TANLA
ADVENZYMES
SHAILY
DBREALTY
MANORAMA
LXCHEM
EQUITASBNK
BORORENEW
JSFB
PNGJL
Model portfolio, back tested rebalance record. Entered plus held is that date's list size, which can differ from the 50 stock target. Tickers are not recommendations.
Recent rebalances
The latest 12 rebalances: names on the list, names in and names out
Names on the list, names in and names out at each date; the history page and the CSV have every name.
Sector shifts of 10 points or more
Other, not yet mapped +11 pts
Other, not yet mapped −19 pts, Capital Goods +11 pts
Other, not yet mapped −13 pts
3 such shifts in 132 rebalances; the latest six. Equity sleeve, equal weighted at the stock level.
Get the next rebalance by email
Risk metrics
Microcap against the Nifty 50
Risk and efficiency figures, model, back tested, against the Nifty 50
Metric
Microcap
Nifty 50
Sharpe ratio
1.52
0.73
Sortino ratio
1.42
0.70
Calmar ratio
1.52
0.58
Volatility, a year
24.09%
14.04%
Max drawdown
−26.43%
−16.92%
Best week
+9.09%
+6.36%
Worst week
−10.81%
−6.33%
Weeks up
63.22%
57.47%
Average up week
+2.68%
+1.49%
Average down week
−2.68%
−1.57%
Model, back tested, after charges. Weekly figures over the rolling 5 years window to 27 Apr 2026; the Nifty 50 over the same window. Not a promise of future returns.
Risk band
Moderately High on a scale from Low to Very High
Deepest model fall
−26.43%
Time horizon
5 years or longer. Drawdowns of 26% have happened in the backtest and can happen again. Capital you might need within 12 months should not be here.
CAGR, Sharpe and max drawdown on the cards: Model, back tested. As of 27 Apr 2026. Take the risk profile to see which bands sit within yours.
Methodology
How it works
1
Universe
Start from the Nifty Microcap 250, filtered to stocks priced under ₹5,000.
2
Rank
Score every stock in the universe by a momentum composite: price trend over several look backs, risk adjusted. The top names by score become the candidate list.
3
Select
Hold the top 50 names by score, equal weighted so no single name dominates.
4
Rebalance
Every 2 weeks the model runs again end to end. Names that fall out of the top 50 are sold; new entrants are bought. The full list is published at every rebalance.
Configuration
Universe
Nifty Microcap 250
Type
Momentum
Sleeves
Equity 100
Holdings
50, equal weight
Rebalance
Every 2 weeks, 26 a year
Max stock price
₹5,000
Risk band
Moderately High
Benchmark
Nifty 50; charts draw the Nifty 50 TRI as a CAGR line
Minimum capital
About ₹2,25,000
Back test from
7 May 2021
Metrics window
Rolling 5 years
Prices
NSE BhavCopy; the back test deducts brokerage, STT, exchange charges and GST
Why Microcap
Tick by tick, drawn as data
Fifty stocks from the Nifty Microcap 250 universe, equal-weighted at roughly 2% each, rebalanced every 2 weeks. The deepest cap-curve card on the lineup.
The 50-stock equal-weight structure spreads single-name risk. Individual microcaps can gap violently on no news. Fifty of them at roughly 2% each turn that violence into noise.
Microcap risk shows up in drawdown depth more than return uplift. The segment falls harder than small caps in a correction and takes longer to be believed on the way back. Compare this card's drawdown figures with Smallcap's before choosing between them.
This is not the obvious pick at this minimum capital. Smallcap runs a similar structure one shelf up the cap curve, with more liquid names and a milder regime cycle.
For an investor who specifically wants microcap exposure, distinct cap-curve risk, distinct stock-selection edge, this is the only card on the lineup drawn entirely from microcaps.
Key takeaways
Deep microcap momentum from the Nifty Microcap 250
50 stocks equal-weighted, rebalanced fortnightly
The only card on the lineup drawn entirely from microcaps
Satellite sizing: 5 to 10% of equity next to a diversified core
A description of the strategy, not a recommendation. Decide your own allocation, or ask a SEBI registered investment adviser.
Who it is written for
Written for
Investors who want growth but read a 25% drawdown as opportunity, not panic
Capital
About ₹2,25,000, one share of every holding at recent prices. More capital buys more of each holding and tracks the model weights more closely.
How the rule was built
Machine learning is used in research to search and optimise the model behind each strategy: which signals rank the universe, how many names to hold and how often to rebalance, tested out of sample. The rule that ships is then frozen and published, so the live strategy is a fixed, readable algorithm, not a black box that changes on its own.
Free modules from the RupeeCase Learn library. No sign up.
Costs
One fee per rebalance
0.2%of traded value, charged only when a rebalance trades
No subscription, no AUM fee, no performance fee.
No lock in: the stocks sit in your own demat and you can sell any day the market is open.
Broker side charges (brokerage, STT, exchange charges, GST) are separate and paid to your broker.
A year on the minimum
Minimum capital
₹2,25,000
Rebalances a year
26, every 2 weeks
Book traded each time
30%, an assumption
Platform fee a year, about
₹3,5101.56% of capital
Higher turnover or more capital raises the fee in proportion.
Costs inside the back test
Gross return
+506.22%before costs
Estimated costs
−63.77 ptsbrokerage, STT and taxes
Net return
+442.45%after costs
Nifty 50, same window
+59.62%cumulative
Model, back tested, cumulative over the rolling 5 years window to 27 Apr 2026. Net is gross minus estimated costs, as on the current factsheet. Not a promise of future returns.
RupeeCase is a technology platform, not a fund, a PMS or a SEBI registered investment adviser. Model, back tested. As of 27 Apr 2026. Model figures are after estimated charges and are not actual client returns. Past performance does not guarantee future returns; capital can be lost.
04Questions
Before you commit capital.
What is the Microcap strategy?
50 stocks from the Nifty Microcap 250. The deepest cap-curve card on the lineup. It selects the top 50 momentum names from Nifty Microcap 250 and rebalances every 2 weeks.
What is the minimum investment for Microcap?
About ₹2,25,000, enough to hold one share of every name in the current book at recent prices. The figure moves with the prices of the holdings.
How does Microcap compare to the Nifty 50?
Microcap shows a model CAGR of 37.33% against 9.80% for the Nifty 50 TRI CAGR line (Jan 2021 to Jul 2026), with a Sharpe ratio of 1.52. Model, back tested. As of 27 Apr 2026. Past performance does not guarantee future returns.
What is the worst drawdown Microcap has experienced?
26.43% peak to trough in the model record. The deepest period ran 210 days, from 21 Jan 2022 to 19 Aug 2022. Model, back tested. As of 27 Apr 2026. Drawdowns of similar size can happen again, so size the position for it.
What are the fees on Microcap?
0.2% of traded value per rebalance. No subscription, no AUM fee, no performance fee. On the minimum capital of ₹2,25,000, the platform fee works out to about ₹3,510 a year (1.56% of capital). Assumptions: 26 rebalances a year (every 2 weeks), 30% of the book traded at each rebalance, 0.2% of traded value. Higher turnover or more capital raises the fee in proportion. Broker side charges (brokerage, STT, exchange charges, GST) are separate.
Can I exit Microcap at any time?
Yes. No lock-in. Holdings sit in your own broker demat account and you can sell any name on any market day. Switching strategies or pausing the rebalance is a one-click action on the platform.
05Same family
Mid and small: Midcap 150, Smallcap 250, Microcap.
0.2% of traded value per rebalance. No AUM fee, no lock in. Line behind: the Microcap model record, after charges, as of 27 Apr 2026. Not a promise of future returns.