

Strategy notes..6 min read
Drawdown is the KPI nobody asks about
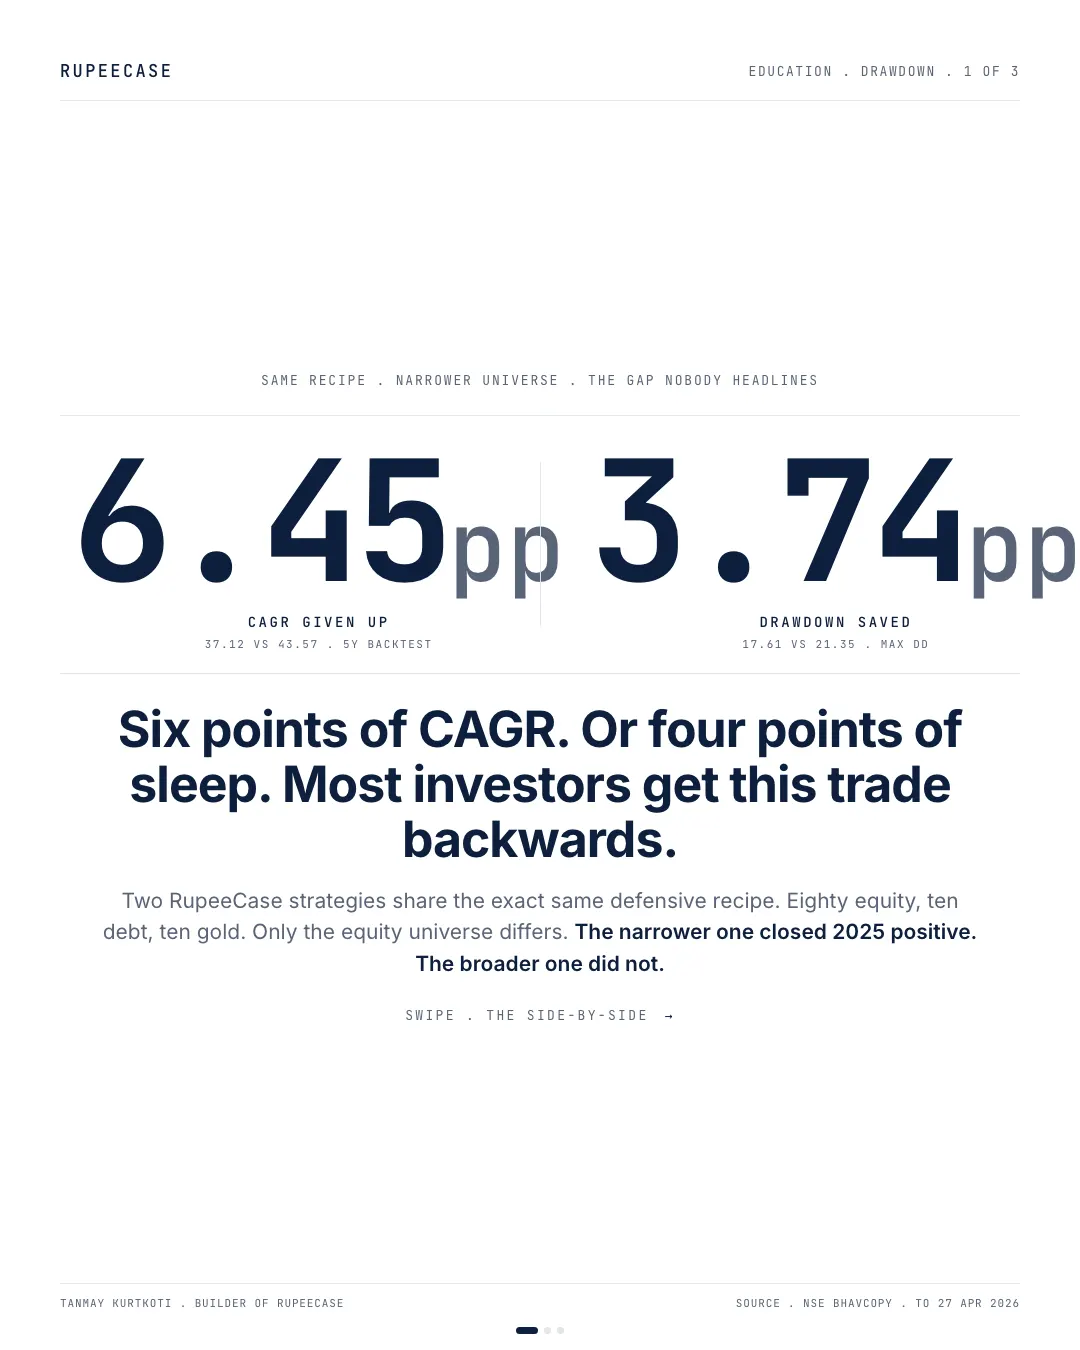
Two RupeeCase cards share the same 80/10/10 recipe and differ only in universe; the narrower one gave up 6.45 points of CAGR and saved 3.74 points of drawdown.
Model, back tested, as of 27 Apr 2026, as published then; the strategy page shows the current figure.
By Tanmay Kurtkoti, founder of QC Alpha and builder of RupeeCase
Pulled the data on the RupeeCase strategies last week (16 cards then, 18 today) and stopped on one comparison.
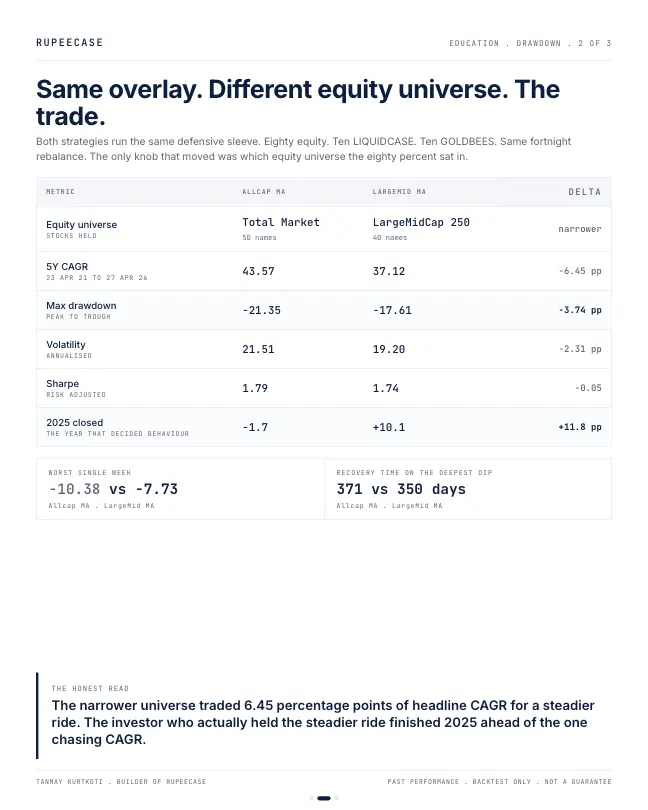
Two strategies share the exact same defensive recipe. Eighty percent equity, ten percent LIQUIDCASE, ten percent GOLDBEES, fortnight rebalance. Same overlay, same cadence. The only knob that moved was which equity universe held the eighty percent. Strategy 05 Allcap Multi Asset runs Nifty Total Market, fifty names. Strategy 10 LargeMid Multi Asset runs LargeMidCap 250, forty names.
Five-year backtest, identical window. Allcap MA delivered 43.57 percent CAGR with max drawdown of -21.35 percent. LargeMid MA delivered 37.12 percent CAGR with max drawdown of -17.61 percent. The narrower universe gave up 6.45 percentage points of headline return. It saved 3.74 percentage points of drawdown, 2.31 percentage points of annualised volatility, and on its worst week the broader version printed -10.38 while the narrower one printed -7.73.
Now the year that decided behaviour. 2025. Allcap MA closed -1.7 percent. LargeMid MA closed +10.1 percent. Same recipe. Different universe. Twelve percentage points of separation in a single calendar year.
Here is the math nobody runs.
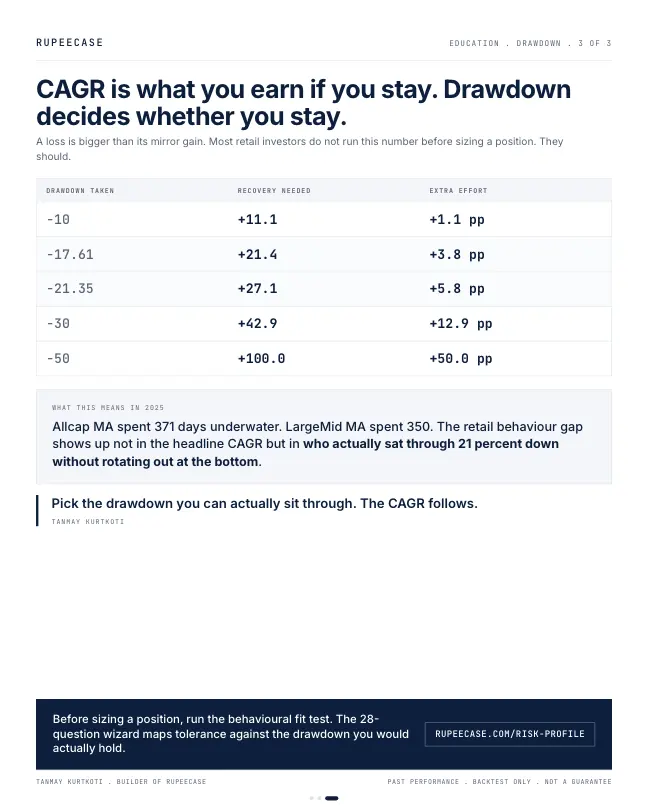
A -10 percent dip needs +11 to break even. A -20 needs +25. A -30 needs +43. A -50 needs +100. The loss is always bigger than its mirror gain, and the gap widens fast as the dip deepens.
Allcap MA spent 371 days underwater on its deepest drawdown. LargeMid MA spent 350. Most retail money does not stay seated for 371 days when the strategy was bought because of a CAGR headline. The strategy that gets held is the strategy that earns its CAGR.
The brochure leads with CAGR. The brochure is wrong about which number matters first. CAGR is what you earn if you stay. Drawdown is what decides whether you stay.
Pick the drawdown you can actually sit through. The CAGR follows.
The 28-question behavioural fit wizard at rupeecase.com/risk-profile maps tolerance against the drawdown you would actually hold.
The twins on today's file
The opening uses the figures published on 5 May. On the current lineup file the trade is the same shape. Allcap Multi Asset: 40.47 percent CAGR, maximum drawdown 21.32 percent, Sharpe 1.81. Large Mid Multi Asset: 34.33 percent CAGR, maximum drawdown 17.60 percent, Sharpe 1.72 (Model, back tested, as of 27 Apr 2026). The narrower universe gives up about six points of CAGR and saves about four points of hole. The factsheets put their worst single weeks at minus 10.37 and minus 7.72 percent.
From Jun 2024 to Apr 2026 both model cards fell into Feb 2025; Large Mid Multi Asset fell less and was back above its old high by Jun 2025, Allcap Multi Asset by Feb 2026.
Depth is one number. Duration is the other.
A maximum drawdown tells you how far. It does not tell you how long. On the monthly model values the two cards had very different waits.
Allcap Multi Asset peaked at the end of Dec 2024, fell 20.7 percent by the end of Feb 2025, and first closed a month above that peak at the end of Feb 2026. Large Mid Multi Asset peaked earlier, at the end of Aug 2024, fell 16.9 percent by Feb 2025, and was back above its peak by the end of Jun 2025.
peak to recovery, Allcap Multi Asset
Model, back tested, month end values, Dec 2024 to Feb 2026
peak to recovery, Large Mid Multi Asset
Model, back tested, month end values, Aug 2024 to Jun 2025
Read those from the bottom rather than the top and the gap is wider. From the Feb 2025 trough, the narrower card needed four months to get back. The broader card needed twelve. Monthly values smooth over the daily path, which is why these counts differ from the daily figures in the opening, but the order is the same.
Why the narrower card fell less
The two cards share everything except the equity universe: 80 percent equity, 10 percent debt, 10 percent gold, rebalanced every two weeks. Allcap Multi Asset picks its fifty stocks from the Nifty Total Market, which runs all the way down into small companies. Large Mid Multi Asset picks forty from the Nifty LargeMidCap 250, the larger end. In a sell off that hits small companies hardest, the broader card holds more of them.
That is also why the broader card earns more in a good market. The same small company exposure that hurt in early 2025 helped in 2023. The calendar years on the factsheets show both sides: Allcap Multi Asset 88.0 percent in 2023 and minus 1.7 in 2025; Large Mid Multi Asset 59.6 percent in 2023 and plus 10.1 in 2025 (Model, back tested, factsheets of 27 Apr and 13 May 2026).
Which one gets held?
What would you do?
It is the end of Feb 2025. You hold Allcap Multi Asset, bought for its headline return. It is 20.7 percent below its Dec 2024 peak.
- Sell and wait for things to settle
The fall becomes permanent. Twelve months later, at the end of Feb 2026, the model was back above its Dec 2024 peak.
- Stay with the rules, as sized
The wait was twelve months from the trough. By the end of Apr 2026 the model was about 11 percent above its Dec 2024 peak.
Month end values from the RupeeCase nav file. Model, back tested, lineup as of 27 Apr 2026.
The right answer only works for someone who can actually stay. That is the opening's argument in one card: the higher CAGR belongs to the people who sat through the longer wait. If a 14 month wait would push you to sell, the 34 percent card you hold is worth more than the 40 percent card you abandon.
Four questions about any drawdown
- How deep?The maximum drawdown on the factsheet.
- How long?Peak to recovery, in months. Ask for it if it is not printed.
- When?Which market caused it, and does your book have the same exposure?
- How much in rupees?Your amount times the depth. That number is the one you will feel.
On Rs 10 lakh, the difference between a 21.32 and a 17.60 percent hole is about Rs 2.13 lakh against Rs 1.76 lakh. Put it in rupees before you choose, because that is how it will look on the day.
The free Learn module on risk management for systematic portfolios covers drawdown limits, sizing and recovery maths with a quiz, and the drawdown recovery calculator works out the climb back from any fall. Related: Large Mid Multi Asset, the card that finished 2025 green and max drawdown is a record, not a limit.
Questions readers ask
What is drawdown duration?
It is how long a portfolio stays below its previous high, from the peak to the first time it gets back above it. On month end model values, Allcap Multi Asset took 14 months from its Dec 2024 peak and Large Mid Multi Asset 10 months from its Aug 2024 peak (Model, back tested).
Is a lower drawdown worth a lower return?
It depends on whether you would hold the higher return strategy through its worst stretch. A higher CAGR is earned only by staying invested; if a deeper or longer fall would lead you to sell, the realised return can end up below the steadier option's.
Why does a broader universe fall more in a correction?
A broader universe such as the Nifty Total Market reaches into smaller companies, which usually fall harder in a risk off sell off. The same exposure tends to help in strong markets, which is why the broader card shows the higher CAGR.
The cards
3 cards. Swipe, or tap to open.
Reading path
Stop 4 of 8 on Before you pick a card
Related
- 5 vs 20 vs 50 stocks: what concentration buys and takes backThree RupeeCase backtests on the same window show five stocks winning the CAGR row and the fifty stock Allcap winning volatility, Sharpe and drawdown.Strategy notes . . 6 min
- Max drawdown is a record, not a limitThe Nifty's worst fall inside the backtest window is 16.92 percent, against about 38 percent in 2020 and 60 percent in 2008, so double the worst number you see.Strategy notes . . 5 min
- The shallow fall compoundsSorted by max drawdown instead of CAGR, Large Mid Multi Asset's 17.61 percent hole was the shallowest in the table and its 2025, up 10.1 percent, the best in the table.Strategy notes . . 9 min
Educational content only. Figures are illustrative and computed on historical or representative data for teaching purposes, not investment advice. Past performance does not guarantee future returns. Sourced from NSE, BSE, SEBI, AMFI and RBI public data.