

Costs: MF, PMS, RupeeCase..6 min read
The mutual fund cost stack
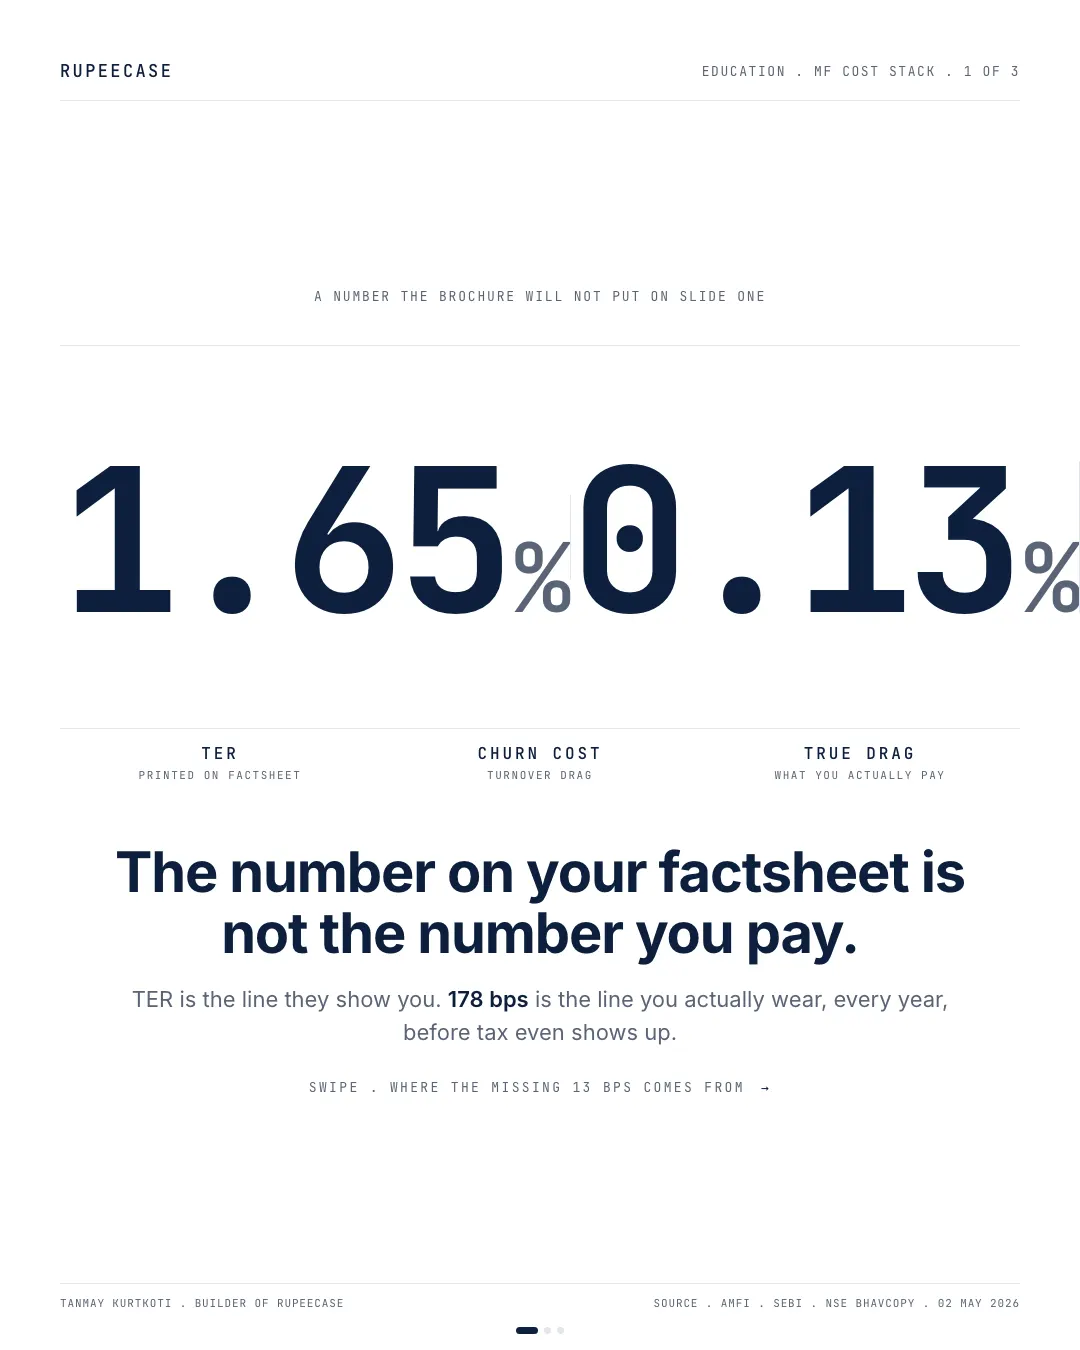
A 1.65 percent TER is only the visible line; add churn, cash drag and the regular plan commission and the honest annual cost of an active large cap fund is near 178 basis points.
By Tanmay Kurtkoti, founder of QC Alpha and builder of RupeeCase
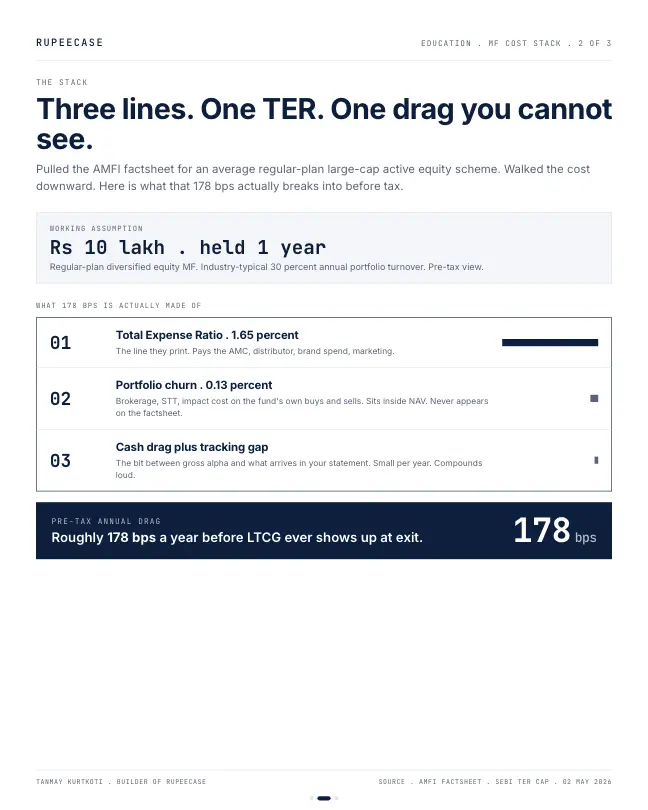
Saturday morning I am staring at an AMFI factsheet for an average regular-plan large-cap active equity scheme. The cover prints 1.65 percent TER like that is the whole story. The honest version sits closer to 178 bps a year. Pre-tax. Before LTCG even shows up at exit.
Here is the part nobody puts on slide one.
TER pays the AMC, the distributor commission, and the brand spend. Underneath that sits a second line. Portfolio churn. Every time the fund manager rotates the book, brokerage and STT come out of NAV before it ever lands on your statement. With industry turnover sitting around 30 percent a year, that quietly adds roughly 13 bps. Then a thin third line on top of that. Cash drag and the small gap between gross alpha and what arrives in your account.
Add the three. That is your real annual fee. The math says the brochure can be telling the truth and still leaving the second and third lines unsaid . rupeecase.com/compare .
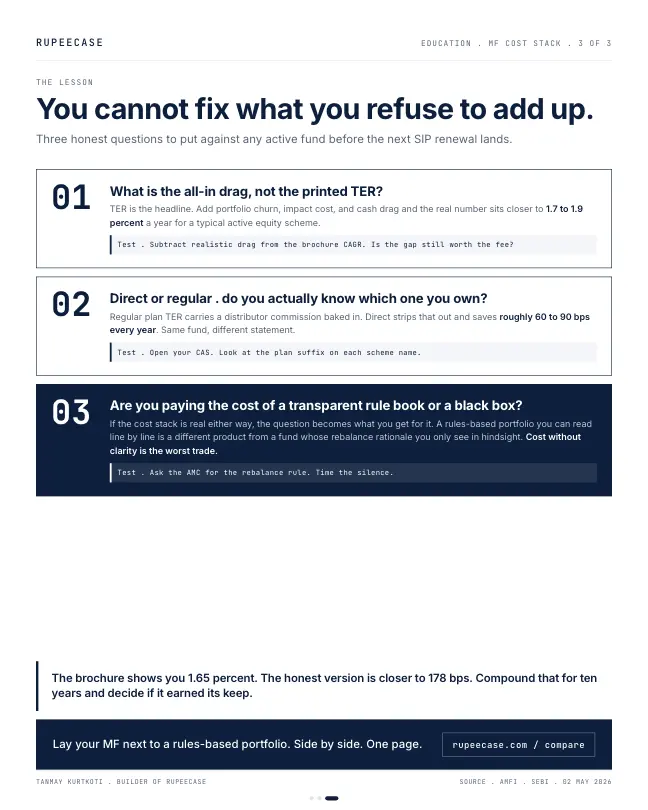
The biggest fixable line in this stack is not the one most people argue about. It is whether you own the regular plan or the direct plan of the exact same fund. Same portfolio. Same manager. Direct strips out distributor commission and saves roughly 60 to 90 bps every single year. Open your CAS at rupeecase.com/learn/ , read the plan suffix on each scheme . that one check is worth more than most stock-picking calls you will read this week.
The question is not whether 178 bps is fair. Some funds earn it. Most do not. The question is whether you are paying it for a transparent rule book or a black box. Cost without clarity is the worst trade.
If you want to lay an MF next to a rules-based portfolio on one page, that is what rupeecase.com/compare is for. And if you have not figured out which kind of investor you actually are before picking, start at rupeecase.com/risk-profile . The strategy hub at rupeecase.com/strategies/ sits at the end of that path, not the start.
The brochure shows you 1.65 percent. The honest version is closer to 178 bps. Compound that for ten years and decide if it earned its keep.
How the expense ratio is built now
The 1.65 percent on that factsheet was printed under the old fee rules. SEBI has since rebuilt how the number is put together. At its board meeting of 17 Dec 2025 it decided that the fee cap, now called the base expense ratio, excludes every statutory levy. STT, GST, stamp duty, SEBI fees and exchange fees on the fund's trades are charged at actuals on top. The total expense ratio you see is the sum of four parts: the base expense ratio, brokerage, regulatory levies and statutory levies.
That matters for the second line of the stack. Some of the churn cost that used to hide inside NAV now has to sit inside the TER you read. The cap on the base part still falls as a scheme grows. Here is the revised ladder for open ended equity schemes.
- Up to Rs 500 crore2.10%
- Rs 750 to 2,000 crore1.60%
- Rs 5,000 to 10,000 crore1.40%
- Rs 20,000 to 25,000 crore1.25%
- Rs 45,000 to 50,000 crore1.00%
- Above Rs 50,000 crore0.95%
Base expense ratio caps for open ended equity oriented schemes, excluding statutory levies. Selected slabs. SEBI board meeting, PR No. 84/2025, 17 Dec 2025.
A cap is a ceiling, not a price. A fund can charge less, and direct plans of the same scheme always charge less because they carry no distributor commission.
Rebuilding the stack on Rs 10 lakh
Here is the stack from the opening, rebuilt line by line so you can redo it on paper. The numbers are a worked example, not a named fund.
- Expense ratio of the regular plan: 1.65 percent a year.
- Churn. The fund turns over 30 percent of its book a year. Every rupee turned over is sold once and bought once. A delivery round trip pays STT of 0.1 percent on each side, stamp duty of 0.015 percent on the buy, NSE charges of about 0.003 percent each side and brokerage. With brokerage at 0.06 percent each side, the round trip comes to about 0.34 percent. Thirty percent of that is about 0.10 percent a year.
- Cash drag. A fund keeps a little cash for redemptions. Say 1 percent of the book earns 5 points less than the stocks would have. That is 0.05 percent a year.
Add the three: 1.65 + 0.10 + 0.05 = 1.80 percent. That is within a few basis points of the 178 in the opening, and the exact figure moves with the fund's turnover and cash.
- Gross returnWhat the stocks in the fund earned.
- Expense ratioBase fee, brokerage and levies, taken daily from NAV.
- ChurnSTT, stamp duty and charges on every rotation.
- Cash dragMoney parked for redemptions, earning less.
- Your NAVThe only return that reaches your statement.
Now put it in rupees. Rs 10 lakh for ten years at a 12 percent gross return grows to about Rs 31.06 lakh with no cost at all. Take away 1.80 percent a year and it ends near Rs 26.41 lakh. Move to the direct plan of the same fund, where the expense ratio is lower by the commission, and say the all in cost drops to 1.10 percent. The same money ends near Rs 28.14 lakh. That Rs 1.73 lakh gap between the two plans is the commission line alone, compounded.
The line you can read in rupees twice a year
You do not have to estimate the commission. SEBI's circular of 20 Sep 2016 made every half yearly Consolidated Account Statement, for the halves ending September and March, show two things for each scheme you hold: the average total expense ratio of your plan for the half year, and the gross commission the fund paid your distributor against your money, in rupees. A direct plan shows no commission line, because it pays none.
That is the check from the opening, done properly. Open the last half yearly CAS, find each scheme, and read the rupee figure. Direct plans themselves have existed since 1 Jan 2013, under SEBI's circular of 13 Sep 2012, with a separate NAV and a lower expense ratio because no commission is paid from them.
MythThe expense ratio on the factsheet is everything the fund costs me.
FactChurn and cash drag sit outside it. The full Learn module on mutual funds walks through each one, free.
None of this says an expense ratio is too high. Some funds earn their fee after costs. The point is to know the full number before you judge it. The free Learn module on mutual fund structure and hidden costs goes through plans, categories and costs with a quiz, and the expense ratio calculator runs your own fund. The companion post on the true cost stack of a regular plan follows one statement line by line.
Questions readers ask
What is the maximum expense ratio for an equity mutual fund in India?
After the SEBI board decision of 17 Dec 2025, the base expense ratio cap for open ended equity schemes runs from 2.10 percent for a scheme up to Rs 500 crore down to 0.95 percent above Rs 50,000 crore. Statutory levies such as STT, GST and stamp duty on the fund's trades are charged on top, and the total expense ratio shows the sum.
Where can I see the commission my distributor earns?
In the half yearly Consolidated Account Statement for the periods ending September and March. Since 1 Oct 2016 it shows, for each scheme, the gross commission paid to the distributor against your investment in rupees, and the average expense ratio of your plan.
Is a 1.8 percent yearly cost a big difference over ten years?
On Rs 10 lakh at a 12 percent gross return, 1.80 percent a year turns about Rs 31.06 lakh into about Rs 26.41 lakh over ten years. The gap of about Rs 4.65 lakh is almost half the original amount, because the cost compounds the same way the return does.
The cards
3 cards. Swipe, or tap to open.
Explore next
Learn it properly, then see it applied.
- StrategyAllcap strategyNifty Total Market, 50 stocks, every 2 weeks
- CalculatorSIP calculatorFree, with the formula and a worked example
- Free module 6.3Mutual Funds, Structure, Types and Hidden Costs8 min read
- CalculatorExpense ratio impactFree, with the formula and a worked example
- Blog topicCosts: MF, PMS, RupeeCase notes25 notes
Related
- The true cost stack of a regular planStated TER, distributor commission and silent churn stack to about 178 basis points a year, and on Rs 10 lakh over five years that is closer to Rs 95,000 than Rs 17,000.Costs: MF, PMS, RupeeCase . . 6 min
- A 1 percent fee does not cost you 1 percentOn Rs 10 lakh at 12 percent gross for 25 years a 1.00 percent fee costs 20.1 percent of the ending corpus, and more than half of that is charged in the last five years.Costs: MF, PMS, RupeeCase . . 13 min
- PMS 2 and 20: the rupee mathOn a Rs 25 lakh book earning 18 percent gross, a 2 and 20 PMS fee stack with GST and trading drag takes 4.08 points, and the ten year compounding gap is Rs 38 lakh.Costs: MF, PMS, RupeeCase . . 6 min
Educational content only. Figures are illustrative and computed on historical or representative data for teaching purposes, not investment advice. Past performance does not guarantee future returns. Sourced from NSE, BSE, SEBI, AMFI and RBI public data.