

Portfolio construction..5 min read
Risk profile fit: the drawdown you can actually sit through
Max drawdowns across the RupeeCase shelf ran from 16.92 to 39.48 percent when this was written, and SEBI's two axis rule makes your honest profile the lower of capacity and tolerance.
Model, back tested, as of 27 Apr 2026, as published then; the strategy page shows the current figure.
By Tanmay Kurtkoti, founder of QC Alpha and builder of RupeeCase
Asked myself the question I keep forgetting to ask the people I onboard. Not what is your CAGR target. Not what is your time horizon on paper. Just this . what drawdown can you actually sit through without selling.
The answer almost never matches the strategy they wanted to pick.
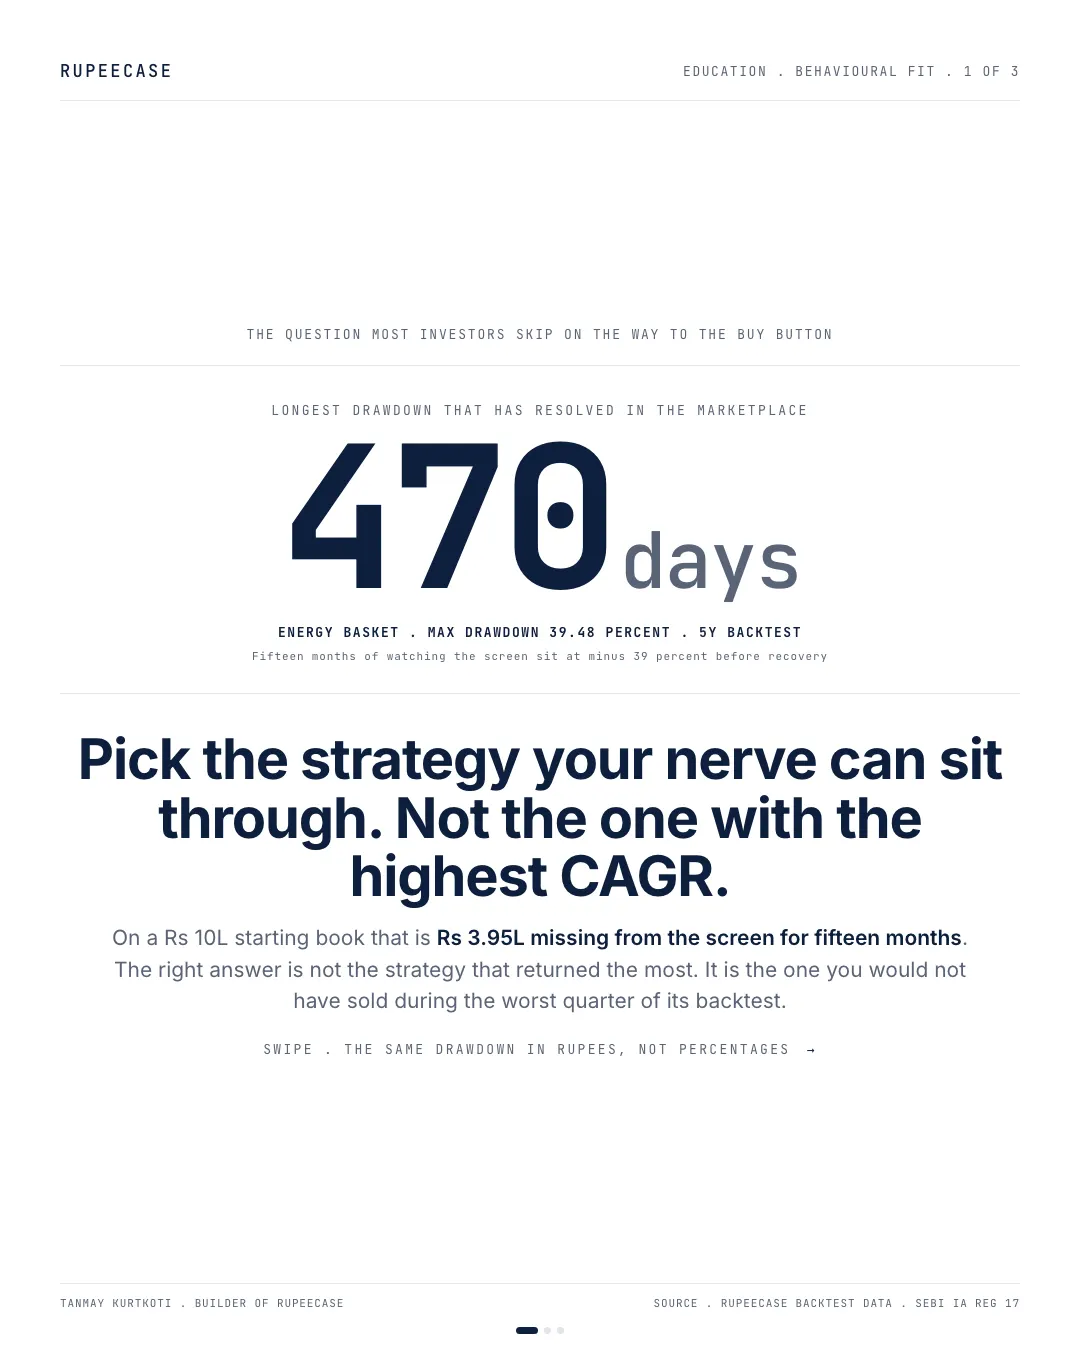
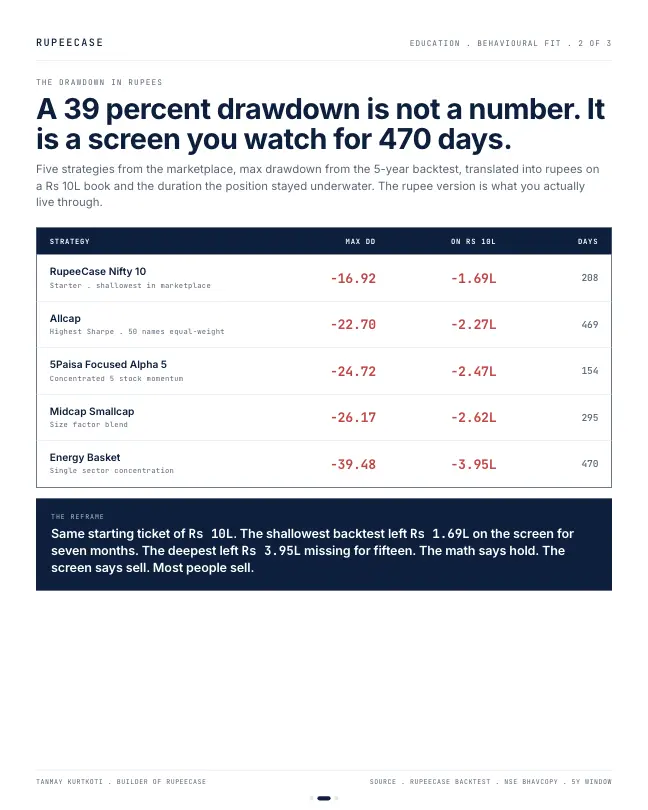
Pulled the max drawdown numbers across the strategies on the marketplace (16 cards then, 18 today). The shallowest, on the since retired RupeeCase Nifty 10 card, was 16.92 percent. The deepest, on Energy Basket, is 39.48 percent. Translate that to rupees on a Rs 10L starting book and you are looking at Rs 1.69L missing from the screen for 208 days at the shallow end, and Rs 3.95L missing for 470 days at the deep end. Same starting capital. Wildly different lived experiences. The drawdown reality on every strategy is laid out at rupeecase.com/strategies/
The middle of the range is just as instructive. Allcap, the strategy with the highest Sharpe in the marketplace, just resolved a 469-day drawdown of 22.70 percent in early April 2026. Fifteen months of watching a quarter of the stake sit underwater. The math says hold. The screen says sell. Most people sell. That single behavioural move costs more, in compounding terms, than every fee structure I have ever modelled.
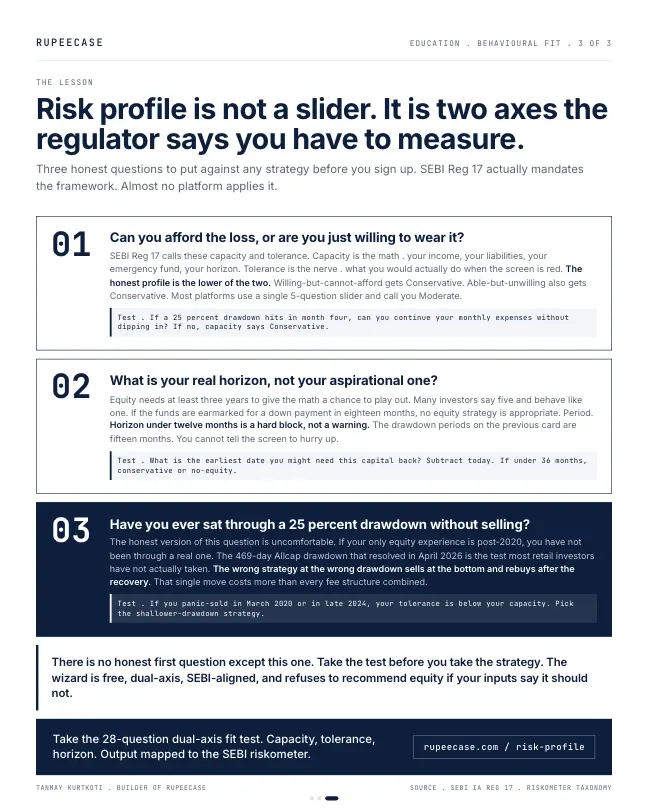
SEBI Reg 17 actually mandates the framework most Indian platforms ignore. The regulation requires two axes . capacity (the math . income, liabilities, emergency fund, horizon) and tolerance (the nerve . what you would actually do when the screen is red). The honest profile is the lower of the two. Willing-but-cannot-afford gets Conservative. Able-but-unwilling also gets Conservative. The longer-form explainer on capacity, tolerance, and the behaviour gap is at rupeecase.com/learn/
The single 5-question slider that outputs Moderate for everyone is not compliant. It is just lazy. The wizard at rupeecase.com/risk-profile runs 28 questions across 10 sections, scores both axes separately, and refuses to recommend equity when the inputs say it should not. Horizon under twelve months. No emergency fund. F&O loss experience. Hard blocks, not warnings.
Honest version. The fix is not picking the safest strategy. The fix is picking the one your particular nerve can sit through, with eyes open about the rupee number you will see on the screen during the worst quarter. Take the test first at rupeecase.com/risk-profile . Then look at the strategy hub at rupeecase.com/strategies/ knowing which row of the riskometer you actually live on.
The compounder rewards the investor who does not sell.
The shelf today, by the worst fall
The lineup has changed since this post was written, so here is the same question on the current figures. Every number below is the deepest fall from a peak in the model, as of 27 Apr 2026.
- Nifty 50 Equal Weight-15.71%
- Large Mid Multi Asset-17.60%
- Allcap-22.72%
- Microcap-26.43%
- Healthcare Basket-33.29%
- Energy Basket-39.48%
Maximum drawdown. Model, back tested, as of 27 Apr 2026. RupeeCase lineup.json.
The percentages look close together on a chart. They are not close in a bank account. Try your own corpus.
On Rs 10 lakh, the Allcap model's worst fall is Rs 2,27,200 and needs a 29.4 percent rise to undo. The Energy Basket figure is Rs 3,94,800 and a 65.2 percent rise. That second climb is more than twice as steep, for a fall that is less than twice as deep. Recovery maths is not linear, which is why the depth you can hold matters more than the return you hoped for.
It happens on the index too
This is not a feature of strategies. The broad market does it. The Nifty Smallcap 250 closed at a record 18,623.15 on 23 Sep 2024 and at 13,755.90 on 3 Mar 2025, a fall of 26.1 percent in a little over five months, by NSE closing data. It has not closed above that record since. The nearest it came after the 2025 low was 18,527.20 on 8 Sep 2026, 0.5 percent short, and on 12 Oct 2026 it was 4.6 percent below, more than two years after the record.
That gap between the bottom and the recovery is where most investors leave. The fall itself takes weeks. The waiting takes seasons.
Two axes, one answer
- Score capacityThe math: horizon, income, debts, emergency fund. How much loss the plan can absorb.
- Score toleranceThe nerve: what you would actually do on a red screen, asked through scenarios, not a slider.
- Take the lower scoreWilling but unable, or able but unwilling, both land on the cautious side.
- Match a drawdown, not a namePick the strategy whose worst fall in rupees you would sit through and still keep the SIP running.
SEBI's Investment Advisers Regulations ask for this structure. The risk profiling rule asks an adviser to assess the client's capacity for absorbing loss, along with their willingness, and to update that assessment periodically. A profile that scores only one of the two is half a profile.
The free Learn module on risk management covers drawdown limits, position caps and the recovery table in more depth, with a quiz at the end. The drawdown recovery calculator gives you the climb back for any fall. For the capacity side in detail, read the lower number is your profile.
Questions readers ask
How do I know how much drawdown I can handle?
Convert the percentage into rupees on your own corpus and ask whether you would keep investing while that amount is missing for a year or more. On Rs 10 lakh, a 22.72 percent fall is Rs 2,27,200. Questionnaires that use scenarios like this are more honest than a single slider.
Why does a 40 percent fall need more than a 40 percent gain to recover?
Because the gain is earned on a smaller base. After a 40 percent fall, Rs 100 is Rs 60, and Rs 60 has to rise 66.7 percent to return to Rs 100.
What is the difference between risk capacity and risk tolerance?
Capacity is financial: how much loss your plan can absorb given your horizon, income, debts and buffer. Tolerance is behavioural: how much loss you can watch without selling. A sound profile measures both and goes with the lower one.
The cards
3 cards. Swipe, or tap to open.
Explore next
Learn it properly, then see it applied.
- GuideHow much equity should you hold at your age? The rule of thumb, and what to use insteadThe 100 minus age rule, and four equity and debt mixes tested on NSE data since 2015.
- Free module 4.1Modern Portfolio Theory, What Actually Matters11 min read
- StrategyEnergy Basket strategyCNX Energy, 10 stocks, every week
- StrategyAllcap strategyNifty Total Market, 50 stocks, every 2 weeks
Reading path
Stop 1 of 8 on Before you pick a card
Related
- The conservative starter is a drawdown number, not a nameMost investors tick the box for a 40 percent drawdown and panic at 15 to 20, which is why the first SIP should be sized to the worst window you would keep adding into.Portfolio construction . . 5 min
- The lower number is your profileA real risk profile scores willingness and capacity separately out of 50 and takes the lower one, which is how a self declared daredevil with an eight month horizon ends up conservative.Portfolio construction . . 5 min
- The calm day contractThe same investor scored Moderately Aggressive on a quiet day and Conservative three weeks into a wobble, so fill the profile on a boring day and treat it as a contract.Portfolio construction . . 5 min
Educational content only. Figures are illustrative and computed on historical or representative data for teaching purposes, not investment advice. Past performance does not guarantee future returns. Sourced from NSE, BSE, SEBI, AMFI and RBI public data.