

Returns and risk maths..5 min read
Rolling returns vs CAGR
A point to point CAGR is a chosen story, and the Nifty 50 TRI's rolling five year windows since 2002 ranged from minus 1.2 to plus 22.4 percent a year.
By Tanmay Kurtkoti, founder of QC Alpha and builder of RupeeCase
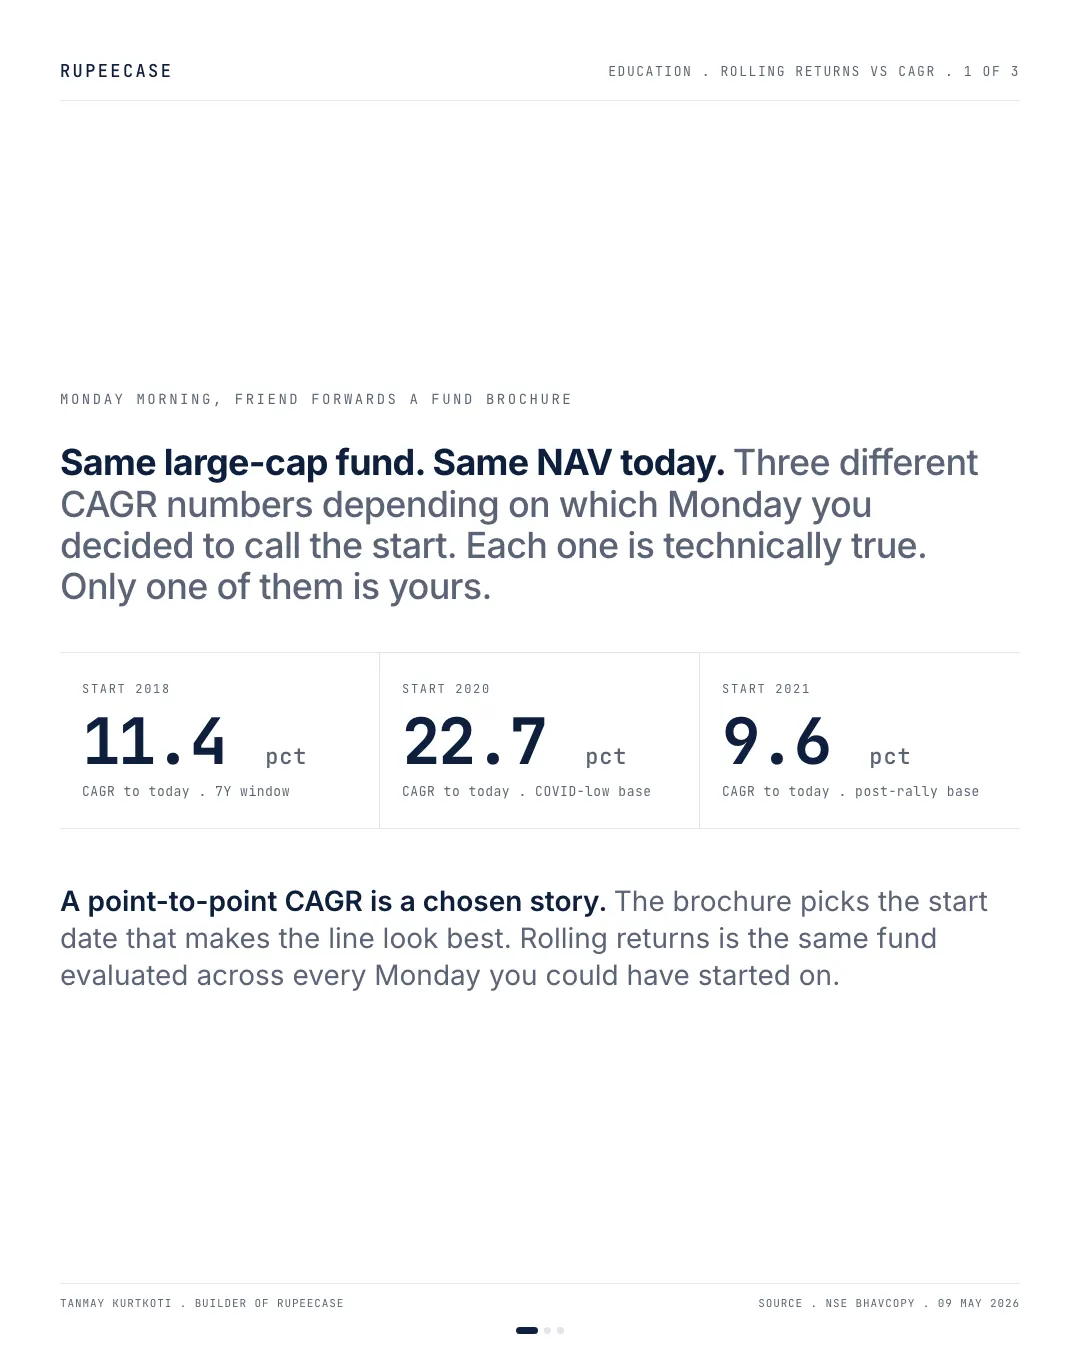
Monday morning. A friend forwards a fund brochure with the headline "18 percent CAGR since 2018". Same fund. Same NAV today. Start the clock in 2018 and you get one number. Start in 2020, off the COVID base, and the CAGR roughly doubles. Start in 2021, after the post-pandemic rally had already done most of the lifting, and the same fund quotes a CAGR that is barely half the headline. All three numbers are arithmetically correct. The brochure prints the one that flatters the line.
That is what a point-to-point CAGR actually is. A chosen story. Start date plus end date plus the number that falls out. Change the start date by a year and the story changes by hundreds of basis points.
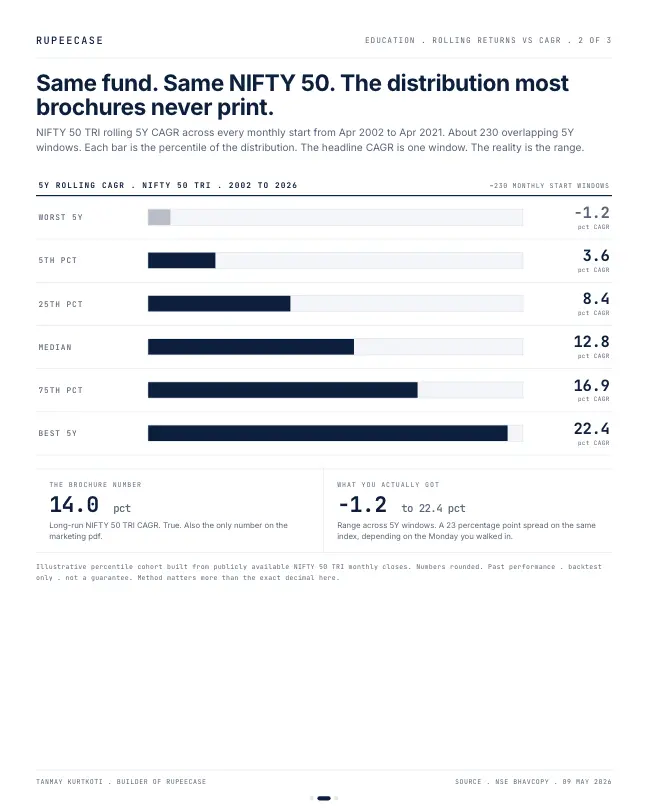
Rolling returns is the same fund evaluated across every Monday you could have started on. Not one window. Hundreds of overlapping ones. NIFTY 50 TRI, monthly start dates from 2002 to today, rolling 5Y CAGR. Around 230 windows. The worst 5Y window came in at minus 1.2 percent CAGR. The 5th percentile at 3.6. The median sits at 12.8. The 75th percentile at 16.9. The best 5Y window at 22.4. Same index, 23 percentage points of spread depending on which Monday a real person walked in. The brochure shows you the 14 percent long-run number. The rolling distribution shows you the regime risk the brochure is averaging over.
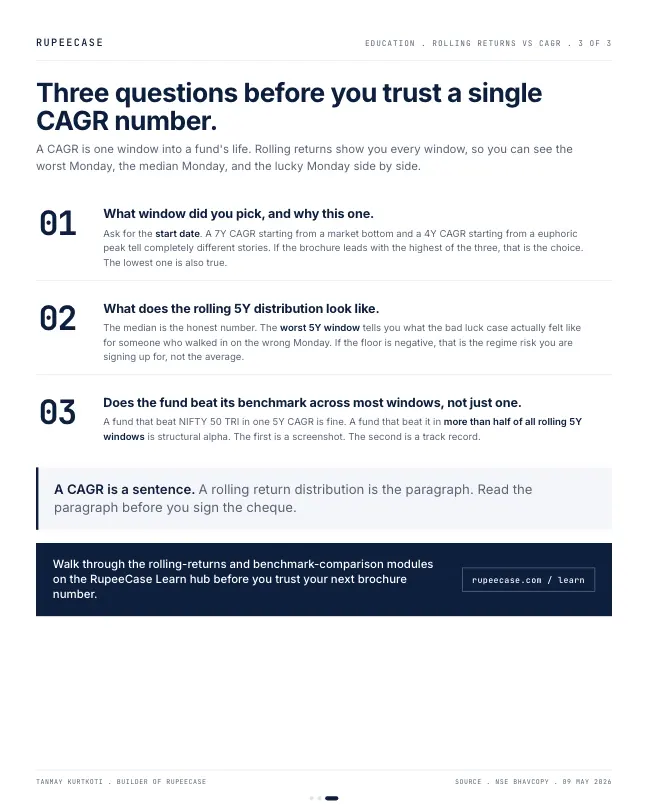
So three questions I now run before I trust a CAGR. Which window did you pick and why this one. What does the rolling 5Y distribution look like, particularly the worst window, because that is what a bad Monday actually felt like. And does the fund beat its benchmark in more than half of all rolling windows, not the one window that ended up on the marketing pdf.
A CAGR is a sentence. A rolling distribution is the paragraph. Read the paragraph before you sign the cheque
The same trick on our own model
I ran the brochure test on one of RupeeCase's own model strategies, so nobody else's fund is in the dock. Same Allcap model, same end point in July 2026. The only thing that changes is the month the clock starts.
- From Jul 2021, 5 years43.6%
- From Jul 2022, 4 years51.8%
- From Jul 2023, 3 years47.4%
- From Jul 2024, 2 years19.3%
- From Jul 2025, 1 year33.2%
Allcap CAGR to Jul 2026 from month end values. Model, back tested, as of 27 Apr 2026. RupeeCase lineup.json. Not client returns.
Every one of those numbers is correct. A page that wanted to impress would print 51.8. A page that wanted to look modest would print 19.3. The model did not change between them. Only the start date did. That is the opening's point, on numbers you can check yourself.
How a start date moves a CAGR
CAGR only reads two points: the value at the start and the value at the end. Whatever happened in between does not enter the formula. So if the start point is a low, the CAGR is flattered. If the start point is a peak, it is punished.
Here is a worked example. A fund NAV is Rs 10 at the start and Rs 25 after five years: a CAGR of 20.1 percent. Now say the NAV had dipped to Rs 7 a year into that stretch. Start the clock at the dip and the same end value gives 37.5 percent a year over four years. Start a year earlier, at Rs 12 after a rally, and it is 13.0 percent over six years.
Three honest start points, three answers from 13.0 to 37.5 percent a year, all ending at the same Rs 25. That spread is what a single CAGR hides.
The paragraph instead of the sentence
A rolling return takes every possible start month, measures the same length of window from each one, and shows the whole set. Here is the Allcap model again, every twelve month window and every three year window that ends between July 2022 and July 2026.
Across 49 one year windows the Allcap model returned between minus 4.2 and plus 150.5 percent, with a median of 29.6; across 25 three year windows the CAGR ranged from 47.4 to 70.2.
Window end month on the x axis. Model, back tested, as of 27 Apr 2026. RupeeCase calculation from lineup.json monthly values.
Two things jump out. First, the one year line swings from deep gains to small losses: an investor who joined in December 2024 saw minus 4.2 percent after a year, one who joined in February 2023 saw plus 150.5. Same rules, same stocks. Second, the three year line is far calmer. Longer windows narrow the spread, which is why the opening asks for the five year distribution and its worst window, not the best one.
One honest limit: this model history is five years long, so it only has 25 three year windows and no five year rolling set worth the name. The Nifty 50 TRI figures in the opening come from more than two decades of data. Short histories make every distribution look tidier than it will.
- Pick a window lengthOne, three or five years, the length you expect to hold.
- Roll the start monthMeasure that window from every month in the history.
- Read the worst firstThen the median. The best window is the one on the brochure.
- Compare with the benchmarkCount the windows the fund beat it in, not the one it beat it most.
The free module on performance measurement covers rolling returns, alpha and how long a track record needs to be before it means much. A related trap is the since inception number, and why a price index understates a CAGR is in total return vs CAGR.
Questions readers ask
What is the difference between CAGR and rolling returns?
CAGR measures one window, from a chosen start date to a chosen end date. Rolling returns measure the same length of window from every possible start date and show the whole range. One Allcap model CAGR to Jul 2026 reads anywhere from 19.3 to 51.8 percent depending on the start month (Model, back tested, as of 27 Apr 2026).
Why does the start date change a fund's CAGR so much?
CAGR only uses the start and end values. Starting at a low point inflates it and starting at a peak deflates it. A NAV that goes from Rs 10 to Rs 25 in five years is 20.1 percent a year, but from a Rs 7 dip to the same Rs 25 over four years it is 37.5 percent.
Which rolling return period should I look at?
The window that matches how long you expect to hold. Longer windows narrow the range: in the Allcap model, one year windows ran from minus 4.2 to plus 150.5 percent while three year windows ran from 47.4 to 70.2. Read the worst window first, then the median.
The cards
3 cards. Swipe, or tap to open.
Explore next
Learn it properly, then see it applied.
- GuideHow long should you stay invested in equity? What every Nifty 50 holding period since 2012 showsEvery 1, 3, 5, 7 and 10 year window of the Nifty 50 since 2012: how often each one lost.
- Free module 2.3Risk Metrics That Matter8 min read
- StrategyAllcap strategyNifty Total Market, 50 stocks, every 2 weeks
- CalculatorLumpsum calculatorFree, with the formula and a worked example
Related
- The bigger number is the smaller returnA fund up 214 percent over twelve years earned about 10 percent a year, roughly half the 19 percent a year of the fund with the smaller looking figure.Returns and risk maths . . 6 min
- The average year mythIn twenty years of Nifty calendar returns only two landed near the 12 percent long run rate, with nine years above 20 percent and 2008 giving back about half.Returns and risk maths . . 5 min
- The since inception trapA six year old fund's 18.9 percent since inception rode a 75 percent birth year; on the same five years it did 10 against the fifteen year old fund's 13.Returns and risk maths . . 5 min
Educational content only. Figures are illustrative and computed on historical or representative data for teaching purposes, not investment advice. Past performance does not guarantee future returns. Sourced from NSE, BSE, SEBI, AMFI and RBI public data.