

Momentum is the most counterintuitive factor in systematic investing. It says: own the stocks that have gone up a lot recently, because they tend to keep going up for a while. Avoid the ones that have gone down a lot, because they tend to keep falling.
Everything about this feels wrong to anyone trained on value. You buy high and hope to sell higher. You chase performance. You do exactly what the textbooks tell you not to do.
And yet momentum is one of the best documented return patterns in financial history. It has shown up in the US, Europe, Japan and India, and it has kept showing up since Jegadeesh and Titman documented it in 1993. It is also the engine of most of the RupeeCase lineup, which is why I want you to understand both why it works and exactly how it fails. Because it does fail, hard, and the two years to October 2026 were one of those stretches.
Nifty200 Momentum 30 TRI, CAGR since April 2005, back calculated years included
NSE Indices factsheet, 30 Sep 2026
the same index over the last 5 years, all live
NSE Indices factsheet, 30 Sep 2026
five year beta to the Nifty 50: it swings more than the market
NSE Indices factsheet, 30 Sep 2026
its deepest fall in the two years to 9 Oct 2026
NSE index closes
Total return CAGR since base date, to 30 Sep 2026
- Midcap150 Momentum 5022.22%
- Nifty Alpha 50 (since 2004)20.21%
- Nifty200 Momentum 3018.30%
- Alpha Low Volatility 3017.71%
- NIFTY200 Quality 3016.64%
- Nifty200 Value 3016.12%
- Nifty 200 (since 2004)13.46%
Source: NSE Indices factsheets, 30 Sep 2026. Base dates 1 Apr 2005 unless shown. Years before each launch date are NSE's back calculation, a model. Not a promise of future returns.
The evidence: what Jegadeesh and Titman found
In 1993, Narasimhan Jegadeesh and Sheridan Titman published "Returns to Buying Winners and Selling Losers" in the Journal of Finance. Their finding: US stocks that did well over the past 3 to 12 months kept outperforming over the next 3 to 12 months, and the losers kept losing. The winners beat the losers by roughly 1% a month over the following six months. That is not a rounding error.
Jegadeesh & Titman (1993), Returns to Buying Winners and Selling LosersIt was replicated widely. Rouwenhorst (1998) found it in 12 European countries. Carhart (1997) added it to the standard fund evaluation model. Asness, Moskowitz and Pedersen (2013) found it in "Value and Momentum Everywhere", across equities, bonds, currencies and commodities.
Why momentum exists: three explanations
1. Underreaction to news
Markets do not price new information all at once. When a company reports strong results, the stock rises, but not straight to its new fair value. Investors anchor to the old price, adjust slowly, and the stock keeps drifting up for weeks and months as the news sinks in. Momentum captures that slow repricing.
2. Investor herding
As a stock rises it attracts coverage, upgrades and attention. That feeds itself: price up, more attention, more buying, price up again. The cycle does not reverse until sentiment breaks, and sentiment tends to break suddenly. That is why momentum crashes are sharp.
3. Trend following institutional behaviour
Many institutions follow trends on purpose, and index funds and ETFs now track momentum indices too. Their buying reinforces existing trends. As that money has grown, it may itself sustain part of the effect, and it can also crowd the trade, which makes the exits more violent.
How to measure momentum correctly
This is where most do it yourself momentum goes wrong. The standard academic signal is:
Skipping the last month matters. The latest month's return tends to reverse, not continue: the short term reversal effect (Jegadeesh, 1990). Include it and you are partly betting on the wrong thing.
NSE's own momentum indices use a refinement worth knowing. The Nifty200 Momentum 30 takes each stock's 6 month and 12 month returns, divides each by the stock's volatility, turns them into z scores against the universe, and averages the two. The top 30 are weighted by free float market cap times that score, capped at 5% a stock, and the index is rebalanced every June and December. Dividing by volatility rewards a steady climb over a wild spike, which is a quiet defence against the crashes below.
Momentum in Indian markets: the specific evidence
NSE publishes several momentum indices: the Nifty200 Momentum 30 (launched August 2020), the Nifty Midcap150 Momentum 50 (August 2022), the Nifty500 Momentum 50 and the Nifty Alpha 50, which ranks on a related measure of excess return. Their factsheets tell a consistent story: a large long run edge over the parent universe, with more volatility and deeper falls.
NSE Indices, Nifty Alpha 50 (official momentum index) NSE Indices, Nifty 200 Momentum 30A few India specific observations from that data:
- Momentum has been stronger further down the size ladder. The Nifty Midcap150 Momentum 50 earned 22.2% a year on total return since 2005 against 18.3% for the large and mid cap Nifty200 Momentum 30, with similar five year volatility (19.1% against 19.4%).
- Sector concentration is a known issue. In strong sector rallies, momentum portfolios can pile into one or two sectors. That is a side effect of the rule, not a design goal, and it needs watching.
- Faster rebalancing is not free. Fresher rankings help momentum, but every extra rebalance costs STT, stamp duty and fees. The cadence has to be tested net of costs.
The momentum crash: when it fails
Momentum is the factor most prone to sudden failure. When the market turns sharply, the portfolio is full of the old winners, which often fall hardest, and holds none of the old losers, which often bounce first.
You do not need a textbook case. Watch the last two years.
Rebased to 100 in October 2024, the Nifty200 Momentum 30 fell to about 70 by April 2025 while the Nifty 500 fell to about 86; by October 2026 momentum was at 78.5, value at 100.9 and the Nifty 500 at 92.7.
Source: NSE index closes on the 9th of each quarter month, 9 Oct 2024 to 9 Oct 2026, price only, rebased to 100.
Read the chart slowly. Between October 2024 and April 2025 the momentum index lost about 30% while the Nifty 500 lost about 14%. The rebound came, but momentum never caught up: two years on it was still 21.5% down, while value, the factor nobody wanted in 2020, was slightly up. Same market, same two years. This is what a momentum drawdown feels like from the inside, and it is why I never hold momentum alone.
The classic case, March 2020: the Nifty 50 fell about 38% in ten weeks, from its 14 January record to 23 March, and then rebounded fast. Stocks that had led into the fall were not the ones that led out of it. Global research by Daniel and Moskowitz (2016) shows the same pattern across markets: momentum crashes cluster right after sharp falls, when the market rebounds and the previous losers rally hardest.
The three conditions that produce a momentum crash:
- High market volatility: when India VIX spikes, recent winners tend to be the most crowded and the most exposed to forced selling
- Sharp market reversal: momentum needs trends to persist. A sharp turn kills the trend before it can be captured
- High dispersion of past returns: when the gap between winners and losers is very wide, the crash, when it comes, is correspondingly wide
This is why combining momentum with other factors, especially low volatility, quality and value, matters so much. They tend to hold up when momentum breaks. Module 3.6 shows how to combine them.
What would you do?
It is April 2025. Your momentum index fund is down about 30% in six months. The market is down 14%.
- Switch everything to value
Value went on to do better than momentum over the next 18 months. But you would have sold at momentum's low: the momentum index rose about 11.4% from April 2025 to October 2026, value about 18%. You swapped one bet for another at a bad price.
- Hold, and add a second factor you can stick with
You keep the momentum exposure through its recovery and spread future risk. This is the reason multi factor portfolios exist.
- Sell and wait in cash
You lock in the 30% fall. Both momentum and the market were higher by October 2026.
NSE index closes, 9 Apr 2025 to 9 Oct 2026, price only. A past episode, not a forecast.
Momentum variants worth knowing
| Variant | Signal | Lookback | Best for |
|---|---|---|---|
| Cross sectional | Rank by return against peers | 12M minus 1M | Long only equity, most strategies |
| Time series (absolute) | Return against its own history | 12M | Tactical allocation, market timing |
| Risk adjusted | Return ÷ volatility | 6M and 12M | Smoother signal, used by NSE indices |
| Earnings momentum | Direction of earnings revisions | Quarterly | Combined with price momentum |
| 52 week high | Closeness to the 52 week high | 1 year | Simple to compute |
MythMomentum is just chasing tips that are already in the price.
FactIt is a rule applied to every stock in a universe on a schedule, with no stories involved. The edge comes from how slowly markets absorb news, and it has been measured for more than 30 years.
A worked example: reading a momentum rebalance
Say a 50 stock momentum strategy rebalances. Its ranking now puts 9 of its current holdings outside the top 50, and 9 new names inside. The rebalance sells the 9 and buys the 9, leaving the other 41 untouched apart from bringing each back to an equal 2%. If the portfolio is ₹5 lakh, about 18% of it, ₹90,000, is sold and the same bought: ₹1.8 lakh of traded value. At the RupeeCase fee of 0.2% that is ₹360, plus STT of ₹180 and the usual small charges.
Now picture the same strategy during the April 2025 reversal. Turnover jumps, because last quarter's winners collapse out of the ranking at once. That is the momentum crash showing up in your contract notes: more trading, at worse prices, exactly when it hurts. Knowing this in advance is half of holding through it.
Common mistakes with momentum
Buying a momentum fund right after its best year. You inherit last year's winners at their most crowded.
Judging momentum on one bad year. The long run edge in NSE data came with several deep drawdowns along the way.
Holding momentum alone with money you will need. A 30% fall is normal for this factor. Size it so that fall does not force you out.
Ignoring turnover. A momentum rule that trades every week can lose its edge to costs.
How this shows up in RupeeCase
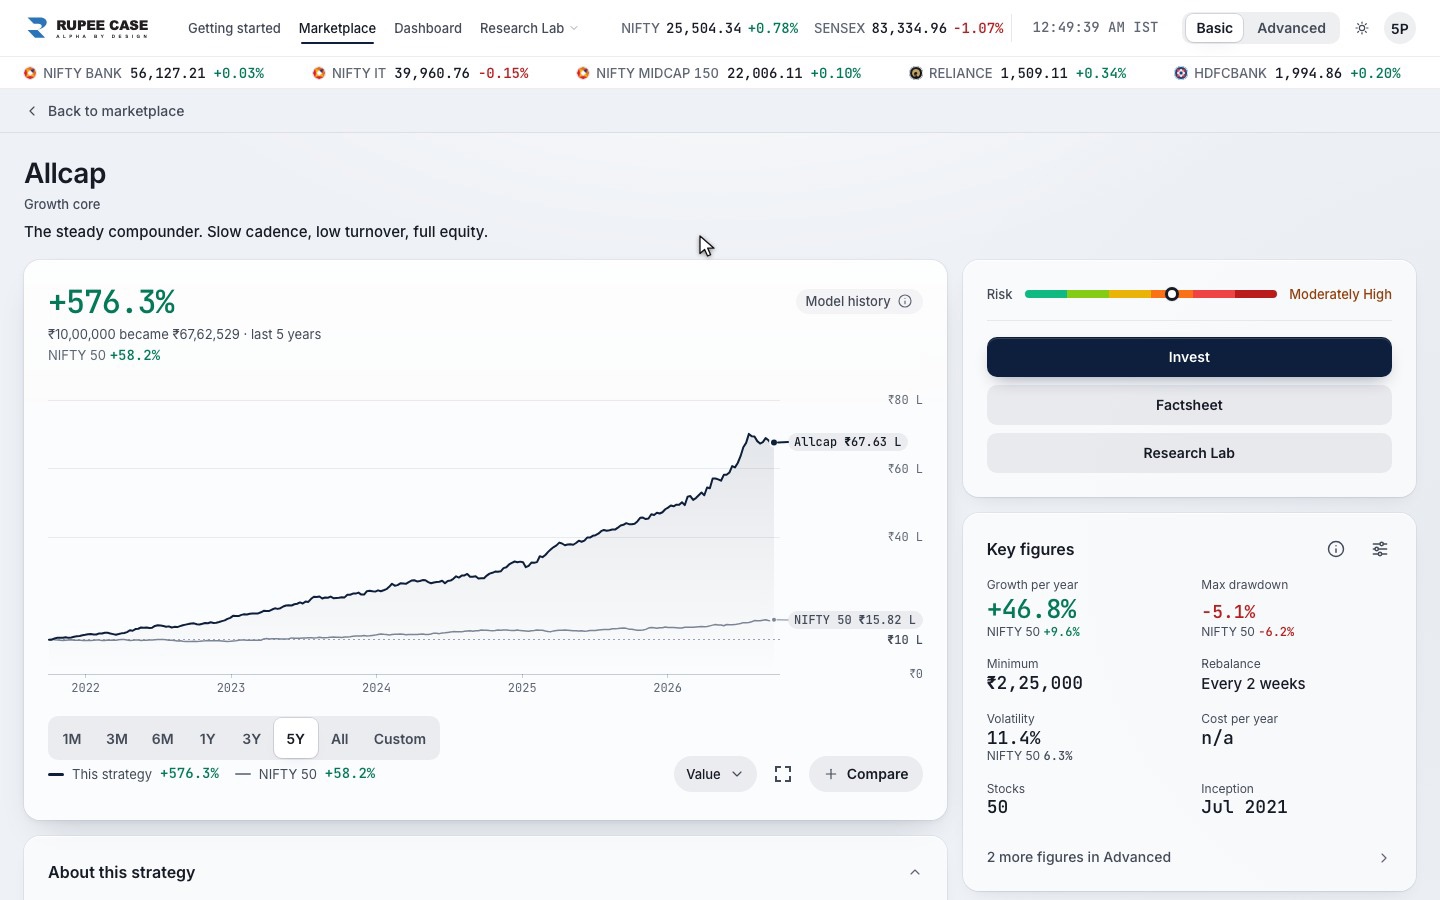
Most of the RupeeCase lineup is momentum, run as rules you can read. Allcap ranks the Nifty Total Market, about 750 stocks with a share price under ₹5,000, holds the top 50 at equal weight and rotates every two weeks. Midcap, Smallcap and Microcap apply the same idea to narrower universes. Allcap Multi Asset wraps the same momentum sleeve with 10% debt and 10% gold to soften the crashes described above. Each page shows the model, back tested history and its worst drawdowns, so you see the bad stretches before you invest.
Is momentum the same as technical analysis?
No. Technical analysis reads chart patterns on single stocks, usually with judgment. Momentum ranks every stock in a universe by one measured number and holds the top slice by rule. No chart reading is involved.
How often should a momentum strategy rebalance?
Often enough that the rankings stay fresh, rarely enough that costs do not eat the edge. NSE's momentum indices rebalance twice a year; many momentum strategies run monthly or fortnightly. Test the cadence net of costs.
Does momentum work in a falling market?
It can hold up in a slow, steady decline, because it rotates out of the weakest stocks. It does worst in a sharp fall followed by a sharp rebound, as in early 2020 and late 2024 to 2025.