

Strategy notes..5 min read
Midcap Smallcap: breadth is not diversification
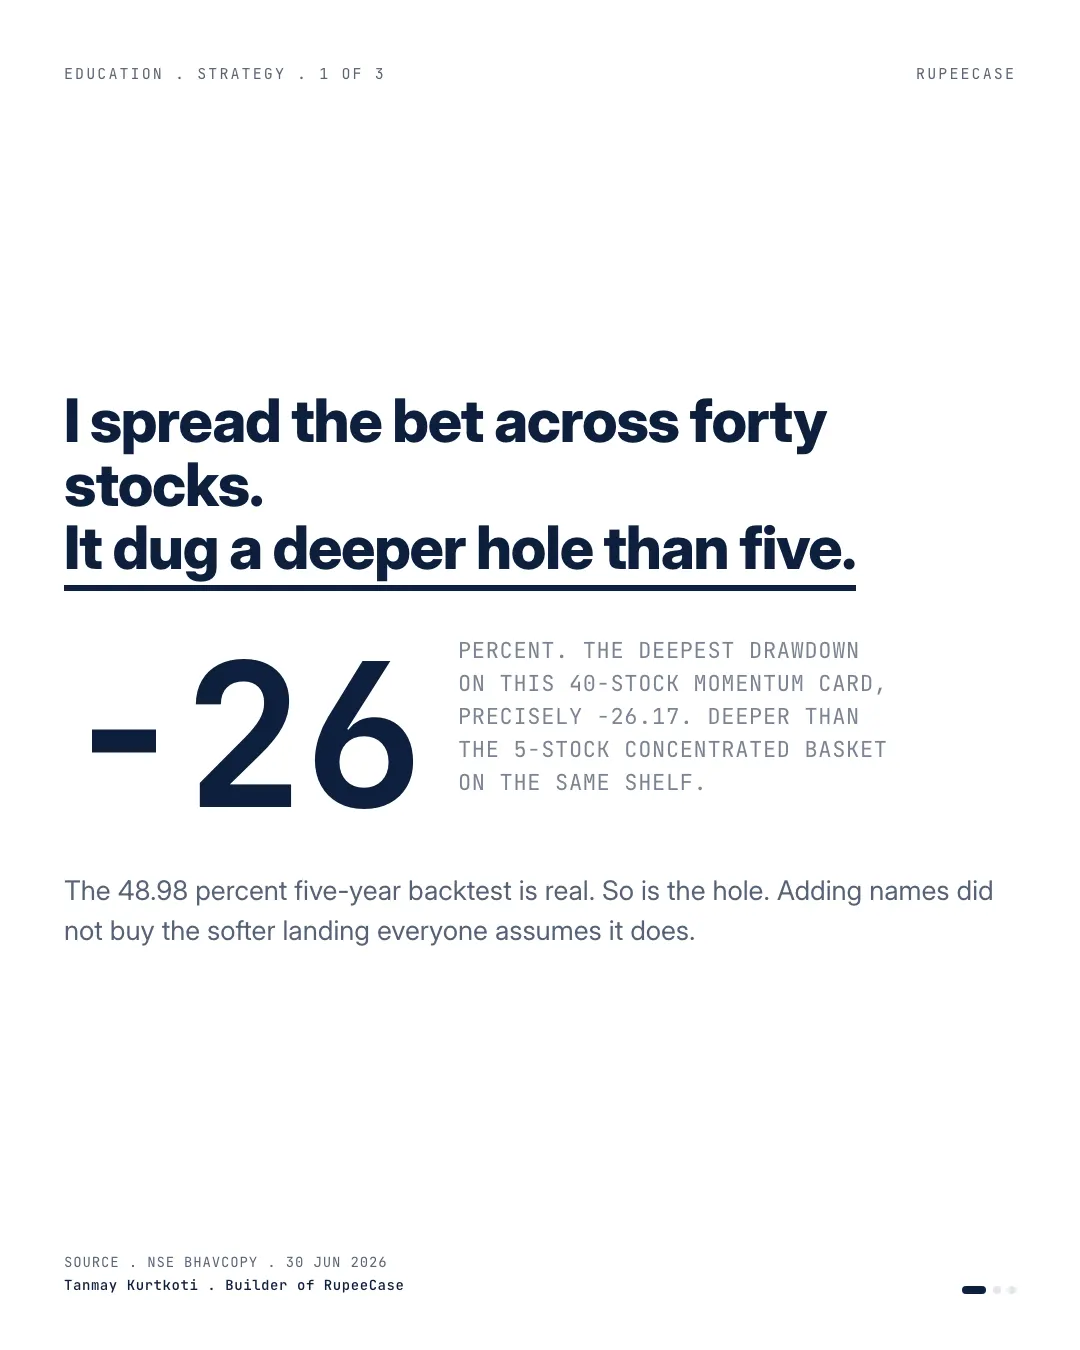
Forty small and mid names dug a deeper hole than the five stock card, 26.17 against 24.72 percent, because forty tickers that fall in the same week are one bet.
Model, back tested, as of 27 Apr 2026, as published then; the strategy page shows the current figure.
By Tanmay Kurtkoti, founder of QC Alpha and builder of RupeeCase
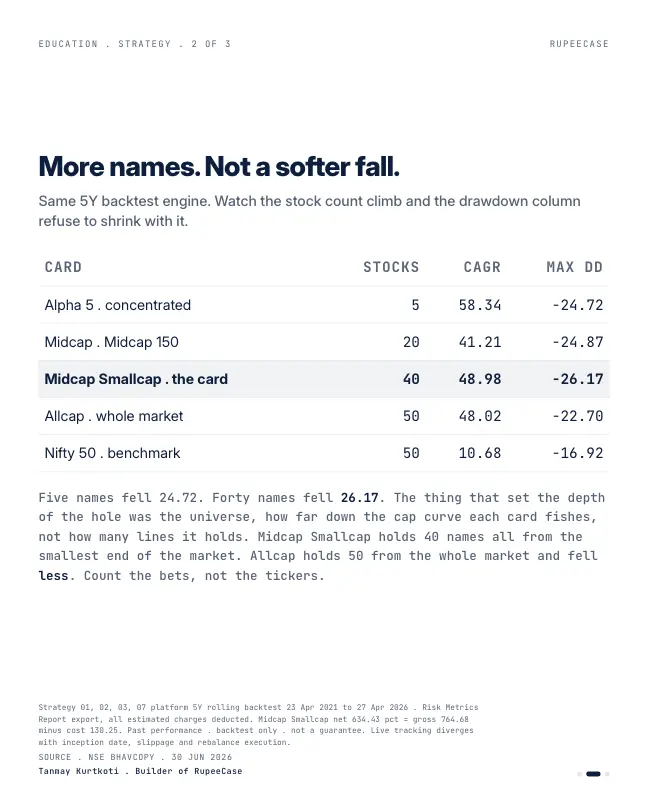
Pulled the factsheet on one of our higher-octane cards this weekend. A 40-stock momentum basket built from the smallest end of the market. Five-year backtest CAGR of 48.98 percent against the Nifty's 10.68. The kind of number that makes you stop scrolling.
So I scrolled one column further, to the drawdown. Minus 26.17 percent.
Here is what made me sit up. The concentrated 5-stock card on the same shelf fell less, minus 24.72. The 20-stock midcap card fell 24.87. The 40-stock basket dug the deepest hole of the three. You add 35 names and the floor drops, not rises.
That runs against everything we are taught about diversification. More holdings, less risk. Except it only works for one kind of risk.
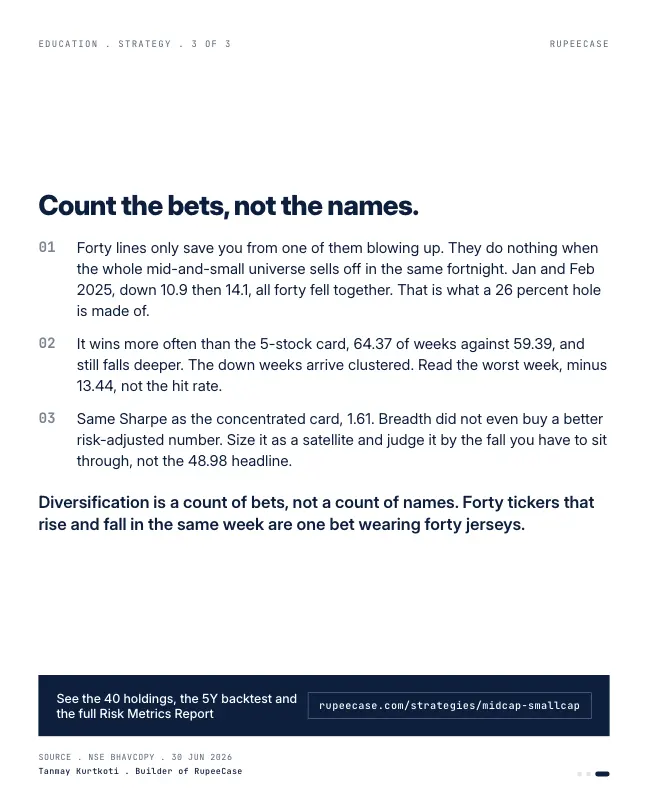
Spreading across 40 names protects you when one of them blows up on a bad result. It does nothing when the whole mid-and-small universe sells off in the same two weeks. January and February 2025, the basket fell 10.9 then 14.1. All forty names fell together, because all forty were the same bet. Mid and small caps in a risk-off do not take turns.
The 50-stock Allcap card, drawn from the whole market instead of just the small end, actually fell less, 22.70. More names, shallower hole, because the names were genuinely different bets across the cap curve.
So the lesson I keep coming back to. Diversification is a count of bets, not a count of names. Forty tickers that rise and fall in the same week are one bet wearing forty jerseys. This card earns its place as a satellite you size small and hold through a 26 percent fall, not as the core you mistake it for because it holds forty lines.
Same Sharpe as the 5-stock card, 1.61. The breadth was a feeling, not a hedge.
The comparison on today's file
The opening uses the figures published on 30 June. On the current lineup file the order is unchanged. Midcap Smallcap, forty stocks: 42.64 percent CAGR, Sharpe 1.63, maximum drawdown 26.17 percent. The five stock Focused Alpha 5 fell 24.18 percent, the twenty stock Midcap 24.87, and the fifty stock Allcap 22.72 (Model, back tested, as of 27 Apr 2026). The forty stock card still dug the deepest hole.
- 5 names, Focused Alpha 5-24.18%
- 20 names, Midcap-24.87%
- 40 names, Midcap Smallcap-26.17%
- 50 names, Allcap-22.72%
Maximum drawdown. Model, back tested, as of 27 Apr 2026. RupeeCase lineup.json.
On the monthly model values, the card fell 10.9 percent in Jan 2025 and 14.1 percent in Feb 2025. Allcap fell 12.1 and 11.4 in the same two months (Model, back tested nav files). Two cards built on the same momentum engine, both hit hard, and the one drawn from the smaller end of the market took the larger second blow.
Counting bets, not names
The opening's line, diversification is a count of bets, has a formula behind it. If every stock in an equal weight portfolio has the same volatility and the same average correlation with the others, the number of truly independent bets the portfolio holds is the number of stocks divided by one plus the number of stocks minus one, times the correlation.
Run the numbers. Forty names with an average correlation of 0.5 come to about 1.95 independent bets. Five names with a correlation of 0.3 come to about 2.27. Fifty names at 0.3 come to about 3.18. And no number of names at 0.5 can ever get past 2. Correlation sets a ceiling that adding names cannot break.
Those correlations are assumptions for the example; nobody publishes them for these cards. But the direction is well established: stocks from one narrow band of the market, sized similarly and owned by similar investors, tend to move together more than stocks drawn from the whole market, and more still in a sell off. That is how forty names can behave like two bets in a bad fortnight.
Two kinds of risk, two kinds of protection
One stock's bad news
- A weak result, a fraud, a lost contract
- Spreading across 40 names cuts it to a fortieth
- Breadth works here
The whole band sells off
- Investors turn cautious on smaller companies
- All forty fall in the same weeks
- Breadth does almost nothing; a different universe or another asset does
That is why the fifty stock Allcap fell less. It is not the ten extra names. It is that its fifty come from the whole market, large companies included, so in a small cap sell off part of the book is fishing in calmer water. And it is why the multi asset cards on the shelf, which add debt and gold, fall less again: those sleeves are genuinely different bets.
Reading breadth on any portfolio
Two questions do more than a count of holdings. Where do the names come from, one band of the market or several? And what else is in the book that does not move with them? A forty stock fund of small companies and a forty stock fund across the market are not the same diversification, even though the holdings count matches.
- Count namesThe number on the factsheet. The least useful of the four.
- Map the bandsLarge, mid, small, micro: how many of the names sit in each.
- Find the other assetsDebt, gold, anything that does not move with the stocks.
- Count betsNames that fall together count as one.
The free Learn module on modern portfolio theory shows why correlation, not the count, decides how much risk diversification removes, with a quiz. The Sharpe and volatility calculator measures the swing of any return series. Related: the Allcap spotlight and 5 against 20 against 50 stocks.
Questions readers ask
Does holding more stocks always reduce risk?
It reduces the risk specific to each company, not the risk the stocks share. If the holdings are highly correlated, as stocks from one narrow band of the market tend to be in a sell off, adding names does little. RupeeCase's forty stock Midcap Smallcap card fell 26.17 percent at its worst, more than the five stock card's 24.18 (Model, back tested, as of 27 Apr 2026).
What is the effective number of bets in a portfolio?
It is how many independent positions a portfolio behaves like. For equal weights and one average correlation, it is the number of stocks divided by one plus the number of stocks minus one, times the correlation. Forty stocks at a correlation of 0.5 behave like about two independent bets.
How do I diversify a small cap portfolio?
Breadth inside small caps protects against single company shocks, not against small caps falling together. Holdings that behave differently, such as larger companies, debt or gold, are what reduce that shared risk. How much of each a reader wants is a separate question about the fall they can hold.
The cards
3 cards. Swipe, or tap to open.
Explore next
Learn it properly, then see it applied.
Related
- Alpha 5: concentration is a position sizeFive equal weight names did nearly fourteen times the index over five years through a 24.72 percent drawdown and 31.68 percent volatility, so size it as a 5 to 15 percent satellite.Strategy notes . . 5 min
- Microcap: the deeper you goStepping from Allcap to Microcap on the same engine flattens the return and widens the drawdown, so the cap curve is a drawdown ladder dressed up as a return ladder.Strategy notes . . 6 min
- Energy Basket: the satellite, not the planetThe Energy Basket pairs the second highest CAGR on the shelf with its deepest drawdown, which is why it only earns a place sized at 5 to 15 percent beside a core.Strategy notes . . 6 min
Educational content only. Figures are illustrative and computed on historical or representative data for teaching purposes, not investment advice. Past performance does not guarantee future returns. Sourced from NSE, BSE, SEBI, AMFI and RBI public data.