

Strategy notes..5 min read
Large Mid Multi Asset: the card that finished 2025 green
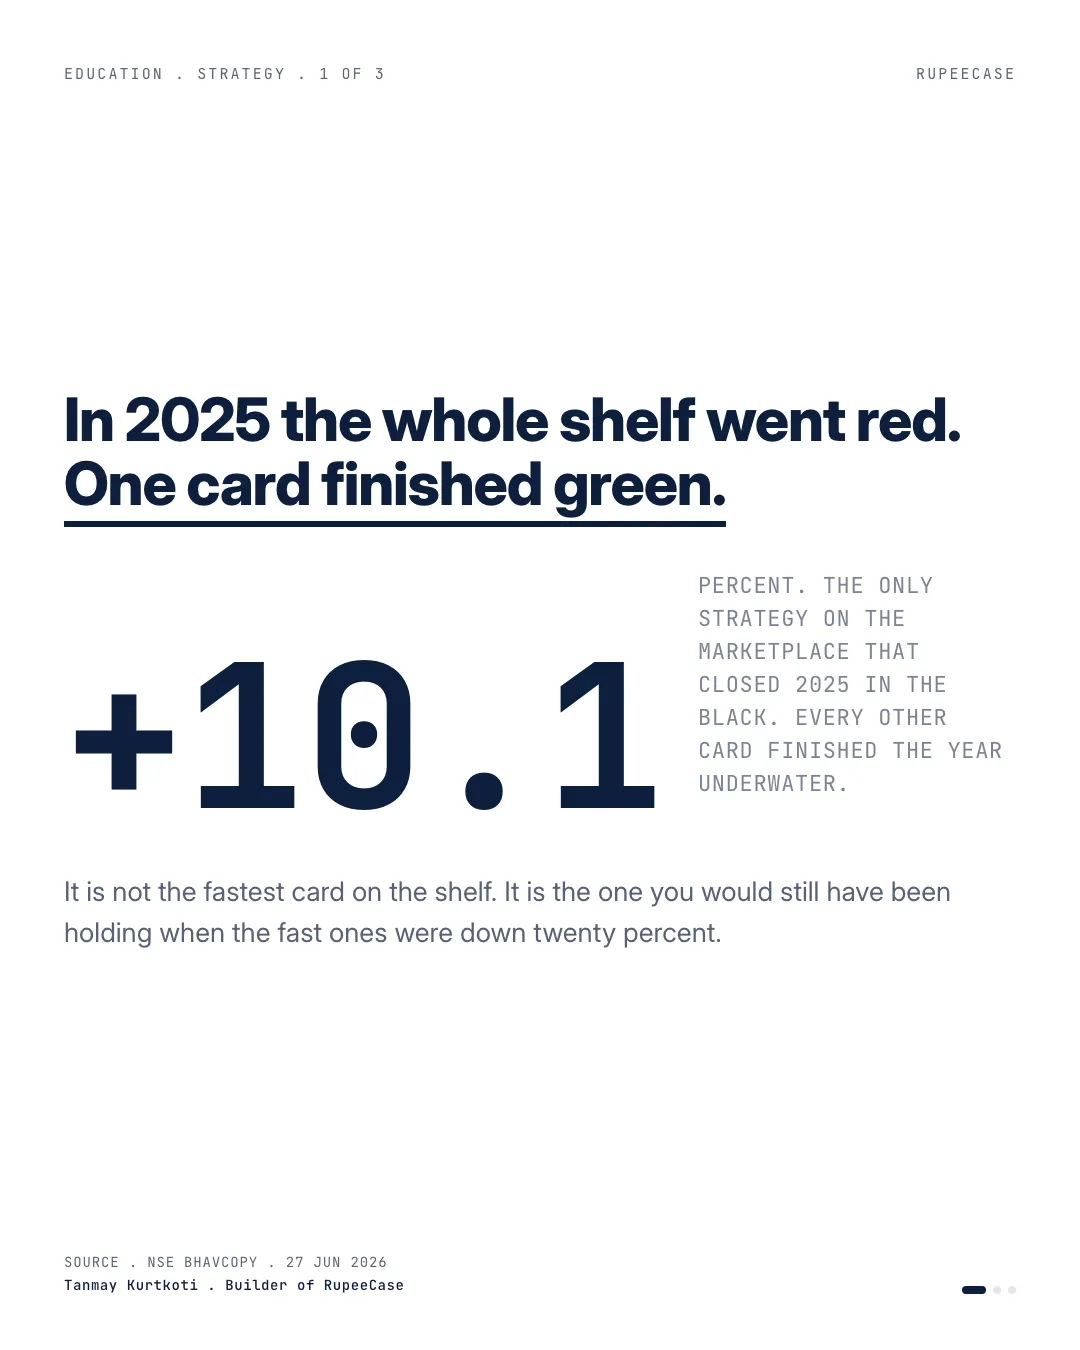
It closed 2025 up 10.1 percent while the broad cards fell, giving up 6.45 points of CAGR for a 17.61 percent worst hole and the highest win rate.
Model, back tested, as of 27 Apr 2026, as published then; the strategy page shows the current figure.
By Tanmay Kurtkoti, founder of QC Alpha and builder of RupeeCase
Saturday morning, I had the RupeeCase marketplace open, sorted by CAGR like everyone sorts it. The Large Mid Multi Asset card sits near the bottom. 37 percent, where the cards above it print 43, 48, even 58.
Easy to scroll past. So I did the thing the sort does not let you do. I looked at how each card finished 2025, the year the broad market actually corrected.
That one column changed the whole picture.
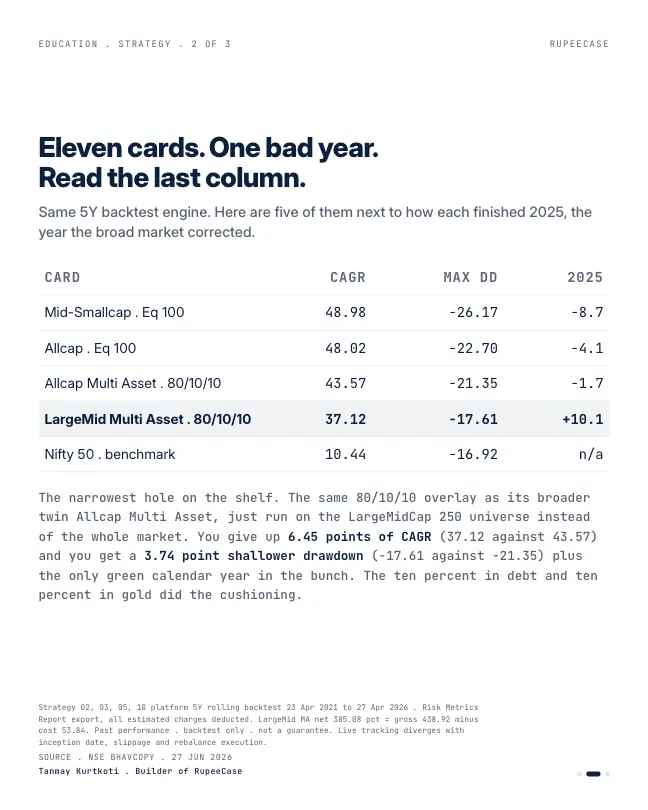
2025 was the test year. The fast cards took it on the chin. Mid-Smallcap closed down 8.7 percent. Allcap down 4.1. Even the broader multi-asset card finished slightly red. This one closed the year up 10.1 percent. On the factsheets as refreshed by Oct 2026, eight of our eighteen cards finished 2025 green, and the three built on the large and mid cap universe were all among them.
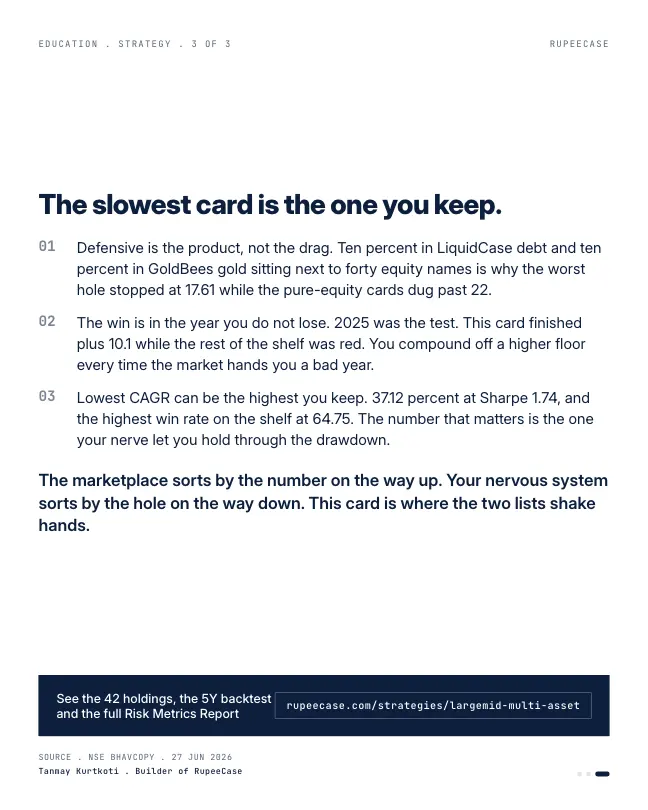
The recipe is almost identical to its broader twin. Forty large and mid-cap names, ten percent in LiquidCase debt, ten percent in GoldBees gold, rebalanced every two weeks. The only real difference is a narrower equity universe. And that single change is the whole story: you give up 6.45 points of CAGR and in exchange you get a 3.74 point shallower drawdown. The worst hole stops at 17.61 percent, where the pure-equity cards dig past 22.
Here is the part the return ranking will never show you. The win is not in the year you sprint. It is in the year you do not lose. A card that finishes plus 10 in a bad year compounds off a higher floor than one that finishes minus 8. Run that across a couple of cycles and the slow card quietly closes the gap on the fast one, at Sharpe 1.74 and the highest win rate on the shelf, 64.75 percent.
The marketplace sorts by the number on the way up. Your nervous system sorts by the hole on the way down. The card you can actually hold is the one where those two lists shake hands: rupeecase.com/strategies/largemid-multi-asset
Past performance is backtest only and never a guarantee.
2025 on today's factsheets
On the current factsheets Large Mid Multi Asset sits near the top of the 2025 column, at plus 10.1 percent.
- Large Mid Multi Asset10.1%
- Large Midcap7.5%
- Large Mid Hybrid7.4%
- Allcap Multi Asset-1.7%
- Allcap-4.2%
- Smallcap-8.7%
Calendar year 2025. Model, back tested, RupeeCase factsheets of 27 Apr and 13 May 2026.
Two other cards beat it in 2025: Nifty 50 Equal Weight at 11.8 percent, and Dynamic Asset Allocator at 18.4 percent, which has a shorter history from Nov 2022 (same factsheets). The lesson is sharper for it: the three cards built on the Nifty LargeMidCap 250 all finished green, and the broad Nifty Total Market cards next to them did not.
What the 80, 10, 10 adds
The card holds forty equal weight stocks from the LargeMidCap 250 in 80 percent of the book, with 10 percent in a liquid debt sleeve and 10 percent in gold, rebalanced every two weeks. Gold is in the mix because it tends to move differently from Indian equities; in a year when stocks struggle, a gold sleeve that holds its value or rises softens the whole book's result.
You can see the sleeves' effect by comparing three cards on the same equity universe. Large Midcap is pure equity. Large Mid Hybrid adds 20 percent debt. Large Mid Multi Asset splits that 20 percent between debt and gold. Their maximum drawdowns are 19.31, 18.27 and 17.60 percent, and their Sharpe ratios 1.69, 1.67 and 1.72 (Model, back tested, as of 27 Apr 2026). The gold version fell least and earned the most per unit of risk of the three.
maximum drawdown, Large Mid Multi Asset
Model, back tested, as of 27 Apr 2026
Sharpe ratio
Model, back tested, as of 27 Apr 2026
share of weeks that finished up
Model, back tested, factsheet, as of 27 Apr 2026
When does the slow card catch the fast one?
The opening says the slow card closes the gap across cycles. That depends on how often bad years come. Here is the test, with the two cards' own numbers. From 2022 to 2024, Allcap Multi Asset averaged about 59.7 percent a year and Large Mid Multi Asset about 46.6 percent. In 2025 they returned minus 1.7 and plus 10.1 (Model, back tested, factsheets).
With three good years to every bad one, as in 2022 to 2025, the fast card stays well ahead. Set the good years to one and the slow card wins the cycle. The honest version of the opening's claim is conditional: the slow card catches up only if bad years come often enough, and over the back test window they did not. What the slow card does deliver, in every case, is the shallower hole on the way.
Reading a multi asset card
- Equity universeDecides most of the return and most of the fall.
- Debt sleeveSteady, low return. Cushions every month a little.
- Gold sleeveIts own swings, often in a different direction from stocks.
- RebalanceEvery two weeks back to 80, 10, 10: selling what rose, topping up what fell.
The free Learn module on gold, commodities and international investing explains how gold behaves next to Indian equities and how it is taxed, with a quiz, and the asset allocation calculator builds a mix from your own weights. Related: drawdown is the KPI nobody asks about and Largecap Hybrid, a buffer is a shock absorber.
Questions readers ask
Why add gold to an equity portfolio?
Gold tends to move differently from Indian equities, so a small gold sleeve can soften the whole book in a bad year for stocks. On RupeeCase's LargeMidCap 250 cards, the version with 10 percent gold and 10 percent debt shows a shallower worst fall, 17.60 percent, than the pure equity version at 19.31 (Model, back tested, as of 27 Apr 2026).
Does a lower return strategy ever catch up with a higher return one?
Only if its advantage in bad years outweighs its shortfall in good years often enough. With three good years to one bad, the faster RupeeCase card stays ahead on its 2022 to 2025 figures; with one good year per bad year, the slower card wins the cycle (Model, back tested).
What is an 80 10 10 portfolio?
A mix with 80 percent in equities, 10 percent in debt and 10 percent in gold, rebalanced back to those weights on a schedule. SEBI's multi asset allocation category requires at least 10 percent in each of three asset classes.
The cards
3 cards. Swipe, or tap to open.
Explore next
Learn it properly, then see it applied.
- Free module 3.1The Momentum Factor11 min read
- StrategyAllcap Multi Asset strategyNifty Total Market, 52 stocks, every 2 weeks
- Free module 6.9Gold, Commodities, and International Investing for Indian Investors8 min read
- CalculatorAsset allocation by risk profileFree, with the formula and a worked example
- StrategyLarge Mid Multi Asset strategyNifty LargeMidCap 250, 42 stocks, every 2 weeks
- Blog topicStrategy notes notes22 notes
Related
- Large Mid Hybrid: the debt sleeve that did two jobsThe 20 percent liquid sleeve softened the worst fall to 18.30 percent and, because it is never traded fortnightly, cut the five year friction bill from 67 to 54 points.Strategy notes . . 6 min
- The shallow fall compoundsSorted by max drawdown instead of CAGR, Large Mid Multi Asset's 17.61 percent hole was the shallowest in the table and its 2025, up 10.1 percent, the best in the table.Strategy notes . . 9 min
- Large Cap Multi Asset: boring is the productThe slowest card on the shelf printed 25.03 percent CAGR at the lowest equity led volatility and cut the 2025 loss of its pure equity twin roughly in half.Strategy notes . . 6 min
Educational content only. Figures are illustrative and computed on historical or representative data for teaching purposes, not investment advice. Past performance does not guarantee future returns. Sourced from NSE, BSE, SEBI, AMFI and RBI public data.