

Strategy notes..6 min read
5 vs 20 vs 50 stocks: what concentration buys and takes back
Three RupeeCase backtests on the same window show five stocks winning the CAGR row and the fifty stock Allcap winning volatility, Sharpe and drawdown.
Model, back tested, as of 27 Apr 2026, as published then; the strategy page shows the current figure.
By Tanmay Kurtkoti, founder of QC Alpha and builder of RupeeCase
Saturday morning I am laying three RupeeCase strategy backtests next to each other on the same screen. Same five-year window to 27 April 2026. Same Nifty 50 benchmark which closed at 10.68 percent CAGR over the period. Three different portfolio sizes. I wanted to see what concentration actually buys you and what it quietly takes back.
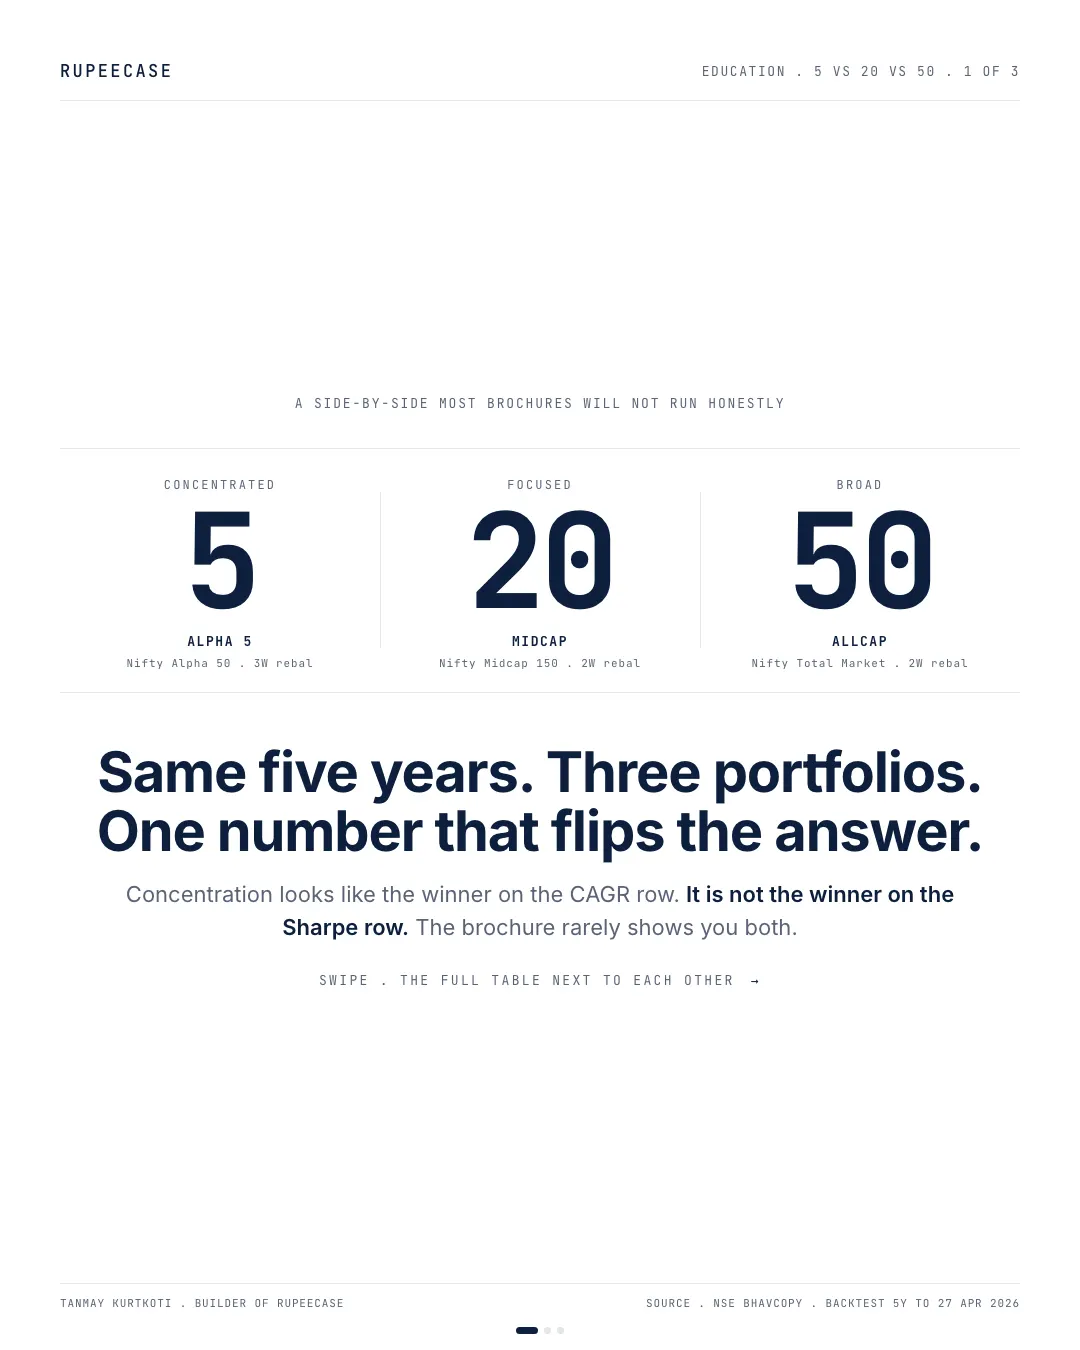
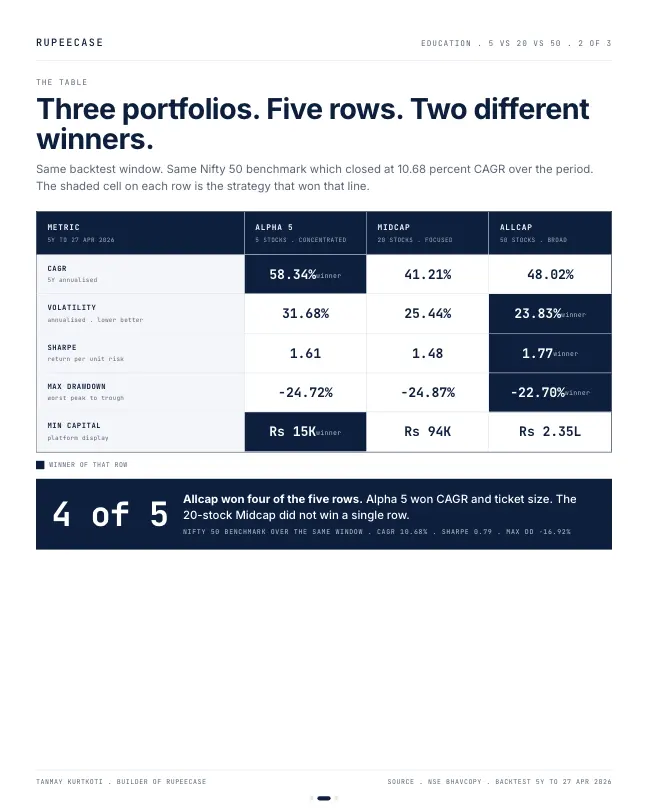
Five stocks. The 5Paisa Focused Alpha 5, picking from the Nifty Alpha 50 universe and rebalancing every three weeks, paid 58.34 percent CAGR over the window. Twenty stocks. The Midcap card on the Nifty Midcap 150 paid 41.21 percent. Fifty stocks. The broad Allcap on the Nifty Total Market paid 48.02 percent. If you read only the CAGR row, the call is obvious. Five wins. Move on.
Here is the part the brochure rarely puts on slide one.
The five-stock portfolio lived through 31.68 percent annualised volatility to deliver that number. The 50-stock portfolio asked for 23.83 percent. Sharpe . return per unit of risk . was 1.61 for Alpha 5 and 1.77 for Allcap. Max drawdown . the worst peak-to-trough . was -24.72 percent on five stocks and -22.70 percent on fifty. The honest scoreboard reads four-rows-to-one in favour of the broad portfolio . rupeecase.com/strategies/methodology shows you the rule book that drove each.
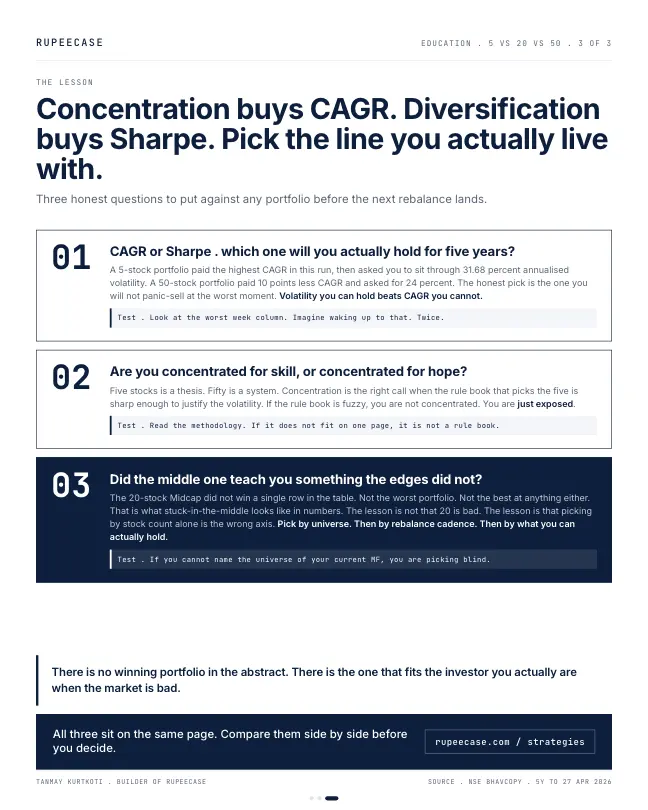
The other thing worth noticing. The 20-stock Midcap did not win a single row. Not the highest CAGR, not the highest Sharpe, not the shallowest drawdown. That is what stuck-in-the-middle looks like in numbers. The lesson is not that 20 is a bad number. The lesson is that picking a strategy by stock count alone is the wrong axis. Universe matters more . rupeecase.com/stocks/ shows you the underlying constituents. Rebalance cadence matters more. Whether you can hold through the worst week matters most.
The honest pick is the one you will not panic-sell at the worst moment. Volatility you can hold beats CAGR you cannot. Concentration is right only when the rule book that picks the five is sharp enough to justify the ride. If the rule is fuzzy, you are not concentrated. You are just exposed.
All three sit side by side at rupeecase.com/strategies/ . And which version of this trade-off you can actually live with is the question the wizard at rupeecase.com/risk-profile exists to answer before you pick.
The three cards on today's file
The opening uses the figures published on 2 May. On the current lineup file the order of the rows is the same. Focused Alpha 5, five stocks: 54.08 percent CAGR, Sharpe 1.60, maximum drawdown 24.18 percent. Midcap, twenty stocks: 38.75 percent, Sharpe 1.49, drawdown 24.87 percent. Allcap, fifty stocks: 44.70 percent, Sharpe 1.68, drawdown 22.72 percent (Model, back tested, as of 27 Apr 2026). Five still wins the return row. Fifty still wins the Sharpe and drawdown rows. Twenty still wins none.
All three model lines rose several times over five years; the five stock line rose most and swung hardest.
What one bad stock does at each size
The mechanic behind those rows starts with position size. Put Rs 1,00,000 in each card. Equal weights mean Rs 20,000 per stock in the five stock card, Rs 5,000 in the twenty, Rs 2,000 in the fifty. Now let one holding fall 50 percent on a bad result.
of the book lost, five stocks
Worked example, one stock down 50%
of the book lost, twenty stocks
Worked example, one stock down 50%
of the book lost, fifty stocks
Worked example, one stock down 50%
The same works upward. A winner that doubles adds 20 percent to the five stock book and 2 percent to the fifty. That is all concentration is: a bigger bet on each idea, in both directions.
Why twenty and fifty are closer than they look
Here is the part that surprised me the first time I worked it through. Adding stocks removes the risk that is specific to each company, but it cannot remove the risk the stocks share, the market moving them together. A simple model of portfolio volatility makes this visible: with every stock at the same volatility and the same average correlation with the others, portfolio volatility is the stock volatility times the square root of the correlation plus the rest divided by the number of stocks.
With these inputs, five stocks give about 23.2 percent volatility, twenty about 20.3, fifty about 19.6, and no number of stocks gets below 19.2. Going from five to twenty removes most of what can be removed. Going from twenty to fifty removes a little more. Raise the correlation, as happens when every stock comes from the same corner of the market, and the floor rises with it.
That is why the opening says the universe matters more than the count. The real cards show it. On the factsheets, annualised volatility is 31.06 percent for the five stock card, 25.44 for the twenty stock Midcap and 23.58 for the fifty stock Allcap (Model, back tested; risk metrics as of 27 Apr 2026 for the first two and 13 Jul 2026 for Allcap). Midcap's twenty names all come from one band of 150 companies. Allcap's fifty come from the whole market. Its stocks are less alike, so its floor sits lower.
Reading the trade off as a reader
- Focused Alpha 5, 5 names31.06%
- Midcap, 20 names25.44%
- Allcap, 50 names23.58%
Annualised volatility. Model, back tested, RupeeCase factsheets; risk metrics as of 27 Apr 2026 (Focused Alpha 5, Midcap) and 13 Jul 2026 (Allcap).
MythMore stocks always means less risk.
FactMore stocks remove company specific risk, not the risk the stocks share. Forty names from one corner of the market can fall further than fifty from the whole of it.
Three questions carry most of the weight when comparing cards like these. How big is each position, and what does one bad stock cost? How alike are the stocks, which the universe largely decides? And what is the worst fall on record, which the drawdown row shows? The CAGR row answers none of them.
The free Learn module on risk metrics that matter explains volatility, drawdown and the Sharpe ratio with Indian examples and a quiz, and the Sharpe and volatility calculator computes both from your own returns. Related: Energy Basket, the satellite and Alpha 5: concentration is a position size.
Questions readers ask
How many stocks do I need to be diversified?
In a simple model with stocks of equal volatility and an average correlation of 0.3, five stocks already remove about three quarters of the risk that diversification can remove, and twenty remove over 90 percent; beyond that the gain is small. How alike the stocks are matters as much as how many there are.
Is a concentrated portfolio riskier?
Each position is larger, so one stock's bad result costs more: a 50 percent fall in one holding costs 10 percent of a five stock equal weight book and 1 percent of a fifty stock book. On RupeeCase's model cards, the five stock card's volatility is 31.06 percent against 23.58 for the fifty stock card (Model, back tested).
Why can a 50 stock portfolio be less risky than a 40 or 20 stock one?
Because the universe matters more than the count. Fifty stocks from the whole market are less alike than twenty or forty from one narrow band, so they fall together less in a sell off. The correlation, not the number of names, sets the floor.
The cards
3 cards. Swipe, or tap to open.
Explore next
Learn it properly, then see it applied.
Reading path
Stop 5 of 8 on Before you pick a card
Related
- Drawdown is the KPI nobody asks aboutTwo RupeeCase cards share the same 80/10/10 recipe and differ only in universe; the narrower one gave up 6.45 points of CAGR and saved 3.74 points of drawdown.Strategy notes . . 6 min
- Max drawdown is a record, not a limitThe Nifty's worst fall inside the backtest window is 16.92 percent, against about 38 percent in 2020 and 60 percent in 2008, so double the worst number you see.Strategy notes . . 5 min
- The shallow fall compoundsSorted by max drawdown instead of CAGR, Large Mid Multi Asset's 17.61 percent hole was the shallowest in the table and its 2025, up 10.1 percent, the best in the table.Strategy notes . . 9 min
Educational content only. Figures are illustrative and computed on historical or representative data for teaching purposes, not investment advice. Past performance does not guarantee future returns. Sourced from NSE, BSE, SEBI, AMFI and RBI public data.