

Strategy notes..5 min read
Allcap: the number everyone quotes and nobody picks
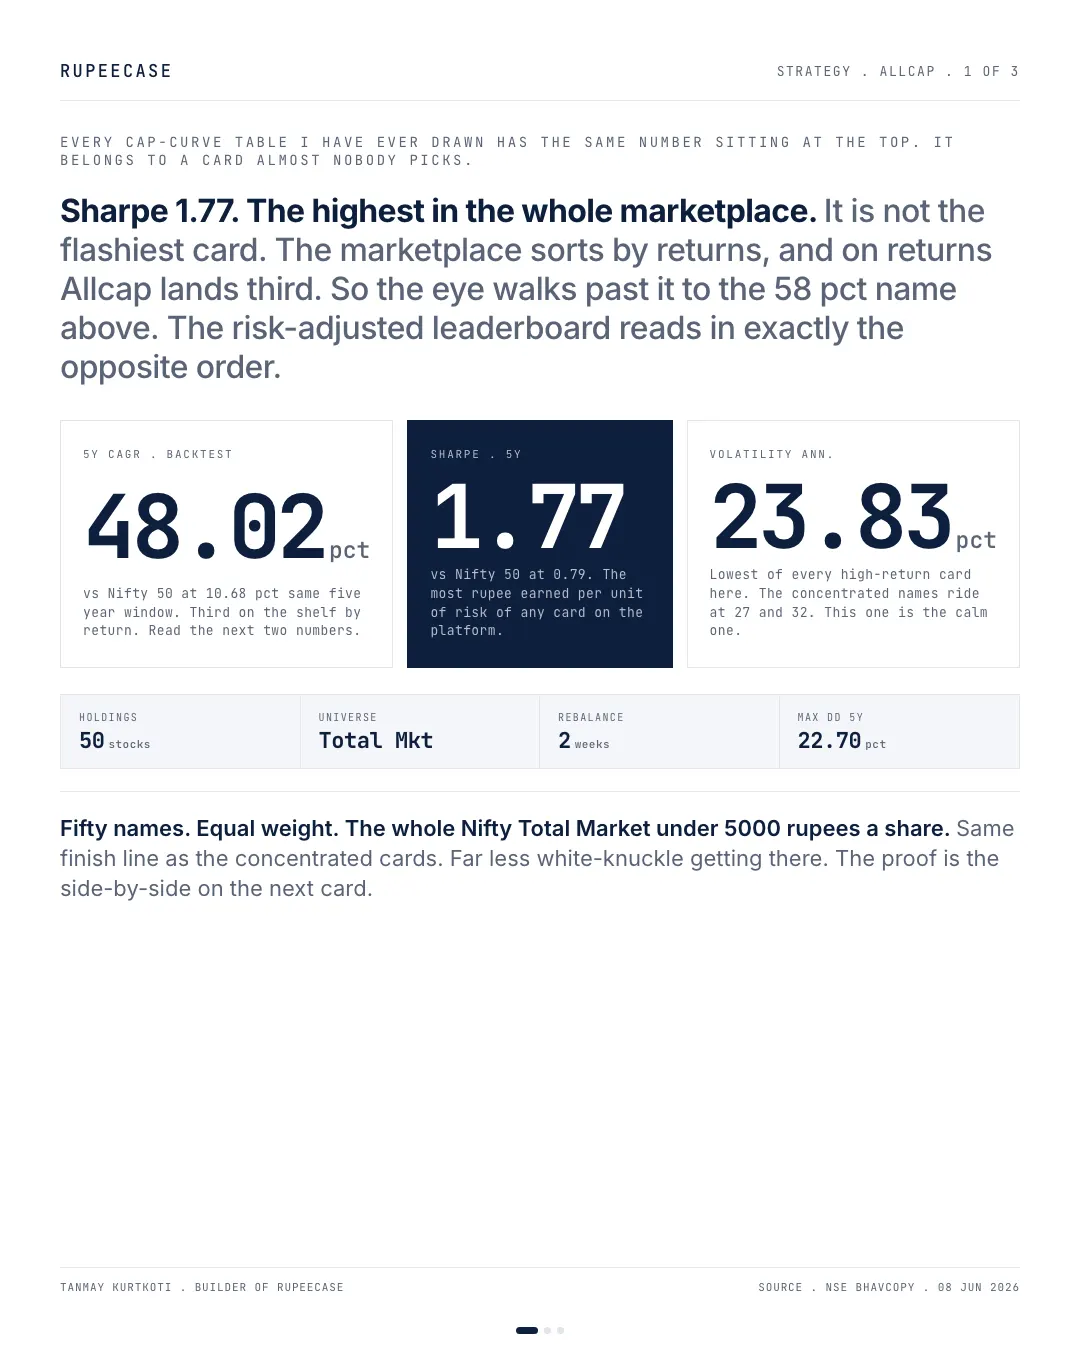
Allcap carried the highest Sharpe of the three momentum cards at 1.77, with the shallowest drawdown of the three, and still spent 469 days underwater.
Model, back tested, as of 27 Apr 2026, as published then; the strategy page shows the current figure.
By Tanmay Kurtkoti, founder of QC Alpha and builder of RupeeCase
Pulled the cap-curve table again last week, the one I keep on a sticky note, and landed on the same quiet contradiction I always do.
The highest Sharpe of our three momentum cards, 1.77 against the Nifty 50's 0.79 when I wrote this, belongs to a card almost nobody picks. Across the whole shelf, five cards led by Dynamic Asset Allocator at 2.32 now rank above it on the lineup of 27 Apr 2026. It is the Allcap strategy. And the reason it gets skipped is structural, not a judgment on the card. The marketplace sorts by returns. On returns, Allcap lands third.
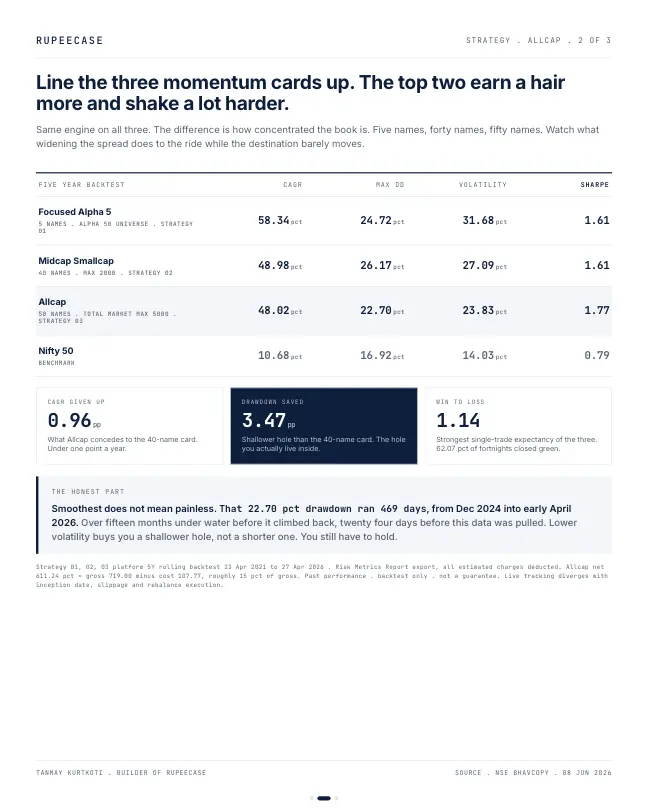
So line the three momentum cards up. Same engine, different concentration. Focused Alpha 5 runs five names and posts a 58 pct backtested CAGR at 32 pct volatility. Midcap Smallcap runs forty names, 49 pct CAGR, 27 pct vol. Allcap runs fifty equal-weight names from the broadest universe on the platform: 48 pct CAGR, but 24 pct vol and the shallowest drawdown of the three at 22.70 pct.
Read that as a trade. Allcap gives up under a single point of CAGR to the 40-name card, and buys a hole three and a half points shallower for it. Strongest win-to-loss ratio of the three too. The destination barely moves. The ride changes completely.
Now the honest part, because smoothest is not the same as painless. That 22.70 pct drawdown ran 469 days, from December 2024 into early April 2026. Over fifteen months under water before it climbed back. Lower volatility buys you a shallower hole, not a shorter one. You still have to hold.
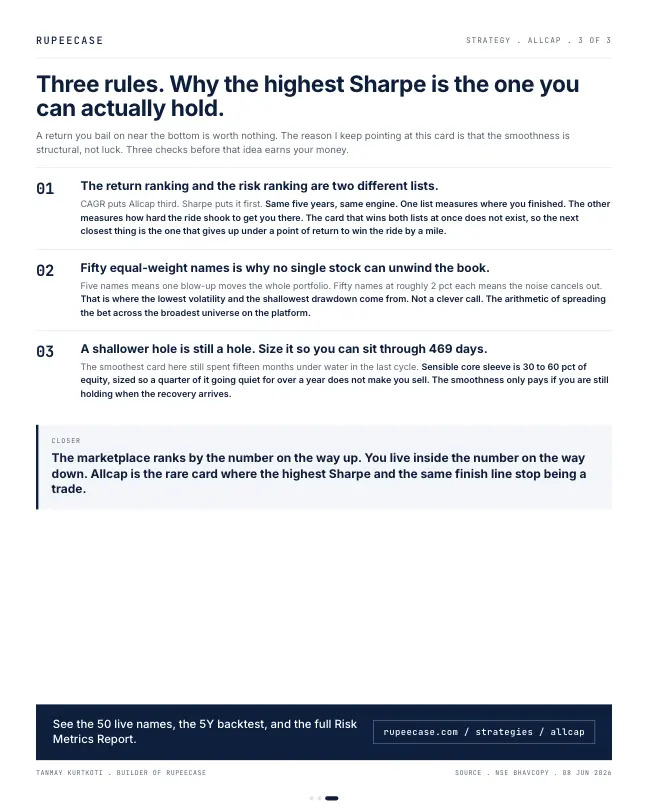
Which is the whole point. A return you bail on near the bottom is worth nothing. Fifty equal-weight names at roughly 2 pct each is why no single stock can unwind the book, and why the ride is smooth enough to sit through. The marketplace ranks by the number on the way up. You live inside the number on the way down.
50 names, the 5Y backtest, and the full Risk Metrics Report: rupeecase.com/strategies/allcap
Backtest results, after estimated charges. Past performance does not predict the future. Markets carry risk including loss of principal.
The three cards on today's file
The current lineup file has moved the figures. Dynamic Asset Allocator, the card at the top of the Sharpe column, has a shorter history from Nov 2022. Among the three pure momentum cards the reading holds (Model, back tested, as of 27 Apr 2026).
- Focused Alpha 5, 5 names31.06%
- Midcap Smallcap, 40 names27.02%
- Allcap, 50 names23.58%
Annualised volatility. Model, back tested, RupeeCase factsheets; risk metrics as of 27 Apr 2026 (Focused Alpha 5, Midcap Smallcap) and 13 Jul 2026 (Allcap).
The CAGR row reads 54.08, 42.64 and 44.70 percent; Sharpe 1.60, 1.63 and 1.68; maximum drawdown 24.18, 26.17 and 22.72 percent (Model, back tested, as of 27 Apr 2026). Allcap is now second on return among the three, ahead of Midcap Smallcap, with the shallowest hole and the highest Sharpe of the group.
What a smoother ride looks like in a single month
Volatility is a yearly number, which makes it hard to feel. Turn it into a month. A rough rule: monthly volatility is the yearly figure divided by the square root of twelve, and a bad month, about two of those, comes along every couple of years.
Put in 31.06 for Focused Alpha 5 and the bad month becomes about 17.9 percent. The record agrees with the rough rule's order. On the monthly model values, Allcap's worst month was minus 12.1 percent, in Jan 2025; Focused Alpha 5's was minus 14.1 percent, in Jan 2023; Midcap Smallcap's was minus 14.1, in Feb 2025 (Model, back tested nav files). On Rs 5 lakh, that is Rs 60,500 against Rs 70,500. Not a huge gap on paper. A noticeable one on the screen, in the month you have to decide whether to stay.
Win size against loss size
The opening mentions the win to loss ratio. The factsheets print the parts. Allcap's average winning week is 2.73 percent and its average losing week 2.48, a ratio of about 1.10. Focused Alpha 5: 3.50 against 3.28, about 1.07. Midcap Smallcap: 2.98 against 3.13, about 0.95, meaning its average losing week is larger than its average winning week (Model, back tested; risk metrics as of 27 Apr 2026, Allcap as of 13 Jul 2026).
Allcap: average win over average loss, weekly
Model, back tested, factsheet
Focused Alpha 5
Model, back tested, factsheet
Midcap Smallcap
Model, back tested, factsheet
Midcap Smallcap still compounds well because it wins more often, 65.13 percent of weeks. Allcap wins a little less often, 62.07 percent, but wins a little bigger than it loses. Two routes to a similar destination, and the second is the calmer one to live with.
The wait, dated
- Peak
The model's month end high.
- Trough
About 22 percent below the peak on month end values.
- Calendar year closes at minus 4.2 percent
Most of the year spent climbing back.
- Back above the peak
Fourteen months after it.
That is the opening's point in dates. A smoother card still asks you to wait. What a rule can do is remove the daily decision from the wait: the card rebalances every two weeks whether the month was good or bad, and nobody has to decide anything in the worst week. That is a system protecting you from yourself, and I trust it more than my own nerve in a falling market.
The free Learn module on building systems that protect you from yourself covers pre commitment, rules and checklists with a quiz, and the drawdown recovery calculator works out the climb back from any fall. Related: Midcap Smallcap, breadth is not diversification and Large Midcap, when the return is a tie.
Questions readers ask
What does annual volatility mean for monthly returns?
As a rough rule, divide annual volatility by the square root of twelve to get a typical monthly swing; a bad month is about twice that. At 23.58 percent a year that gives about 6.8 percent a month and a bad month near 13.6 percent. Real returns have fatter tails than the rule assumes.
What is a win to loss ratio?
It is the average gain in winning periods divided by the average loss in losing periods. A ratio above 1 means wins are bigger than losses on average. A strategy can still do well with a ratio below 1 if it wins often enough, as Midcap Smallcap does at 65.13 percent of weeks (Model, back tested).
Why is the highest return card not always the best choice?
Because the return is earned only by staying through the falls. A card that swings less and falls less can be easier to hold, and a return you actually keep is worth more than a higher one you abandon in a bad month.
The cards
3 cards. Swipe, or tap to open.
Explore next
Learn it properly, then see it applied.
Related
- Large Midcap: when the return is a tie, the drawdown decidesLarge Midcap, Smallcap and Microcap all printed about 41 percent, with holes of 19.30, 22.35 and 26.44 percent, and only the first finished 2025 up.Strategy notes . . 5 min
- Focused Largecap 20: twenty sized bets on a factsheetTwenty equal weight Nifty 100 names on a four week cadence printed 27.40 percent CAGR with a 27.23 percent drawdown, and the multi asset twin nearly matched its Sharpe.Strategy notes . . 5 min
- The cadence question: why two weeksRupeeCase Large Midcap rebalanced 131 times in five years at a 14 day average gap, a cadence chosen to stop a momentum signal rotting without paying quarterly latency.Strategy notes . . 5 min
Educational content only. Figures are illustrative and computed on historical or representative data for teaching purposes, not investment advice. Past performance does not guarantee future returns. Sourced from NSE, BSE, SEBI, AMFI and RBI public data.