

Strategy notes..6 min read
Microcap: the deeper you go
Stepping from Allcap to Microcap on the same engine flattens the return and widens the drawdown, so the cap curve is a drawdown ladder dressed up as a return ladder.
Model, back tested, as of 27 Apr 2026, as published then; the strategy page shows the current figure.
By Tanmay Kurtkoti, founder of QC Alpha and builder of RupeeCase
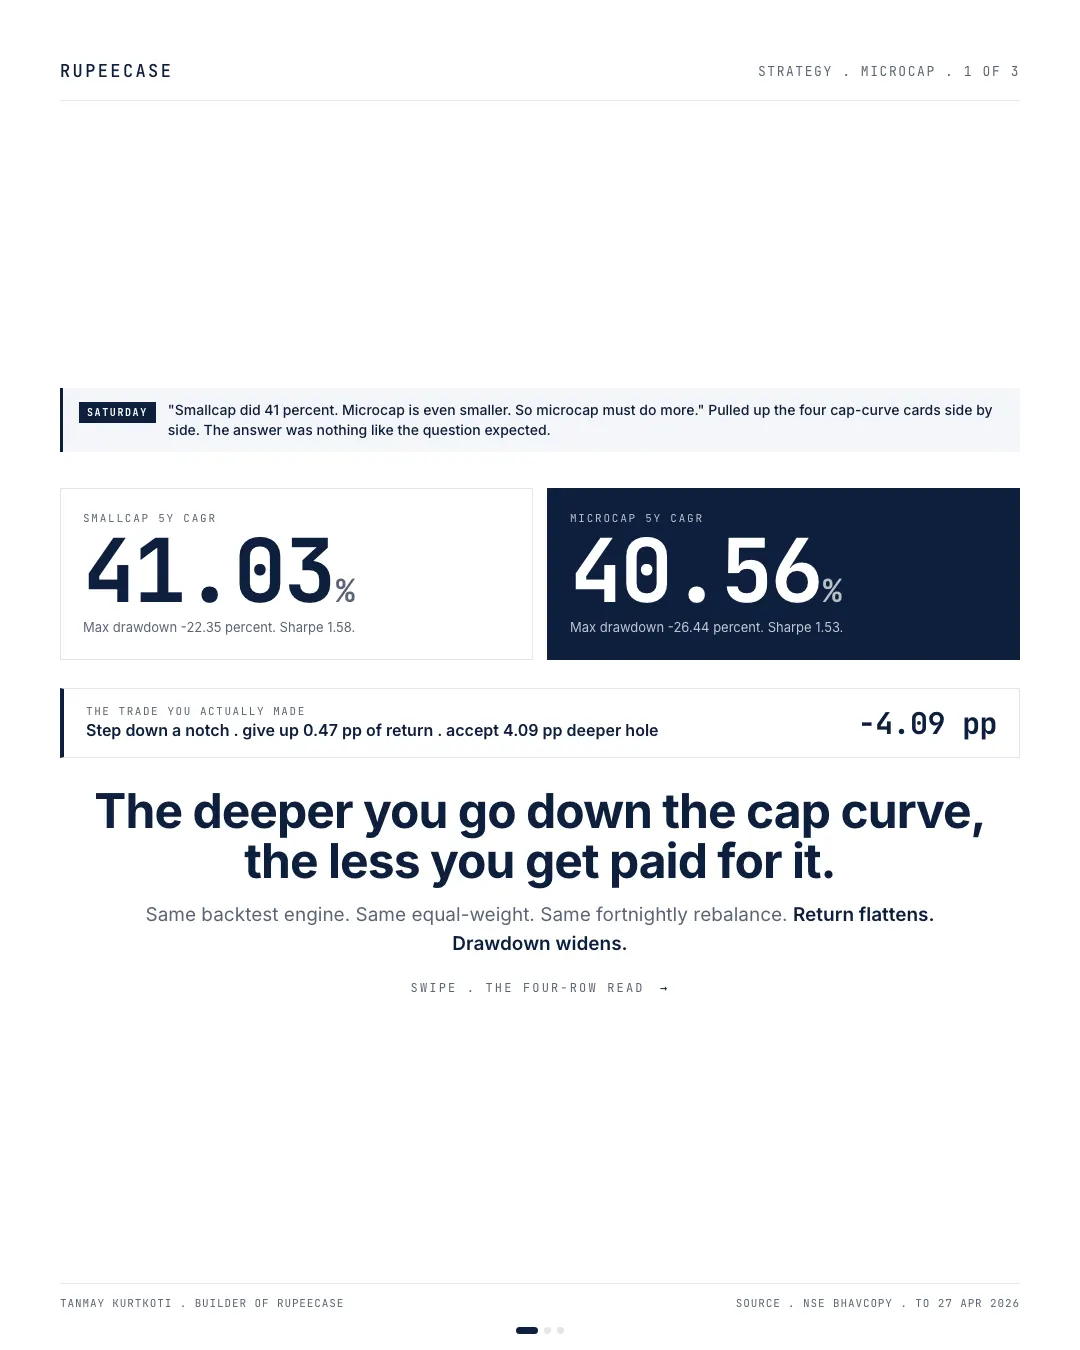
Friend asked over the weekend why we do not just push every rupee into microcap. "Smallcap did 41 percent. Microcap is even smaller. So it should do more."
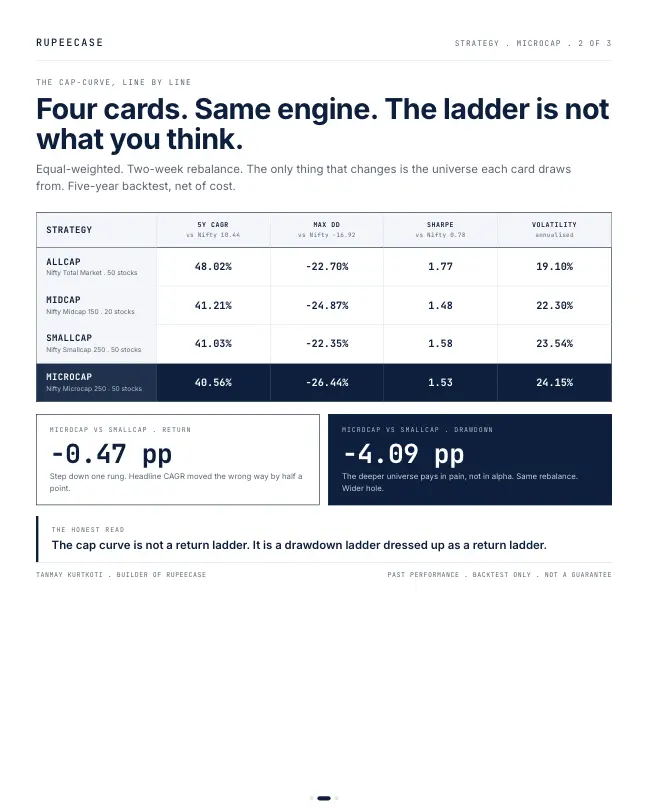
Pulled up the four cap-curve cards on RupeeCase. Same backtest engine. Same fifty equal-weighted stocks (except Midcap which holds twenty). Same fortnightly rebalance. The only thing that changes is the universe you draw from.
Allcap (Nifty Total Market): CAGR 48.02 percent, max drawdown -22.70 percent, Sharpe 1.77.
Midcap (Nifty Midcap 150): CAGR 41.21 percent, max drawdown -24.87 percent, Sharpe 1.48.
Smallcap (Nifty Smallcap 250): CAGR 41.03 percent, max drawdown -22.35 percent, Sharpe 1.58.
Microcap (Nifty Microcap 250): CAGR 40.56 percent, max drawdown -26.44 percent, Sharpe 1.53.
Step down the cap curve. Return flattens. Drawdown widens.
Microcap gives back 0.47 percentage points of CAGR versus Smallcap, then asks for 4.09 percentage points more drawdown to deliver it. The risk-adjusted return (Sharpe 1.53 vs 1.58) moved the wrong way too. The deepest universe paid you in pain, not in alpha.
The honest framing: the cap curve is not a return ladder. It is a drawdown ladder dressed up as a return ladder.
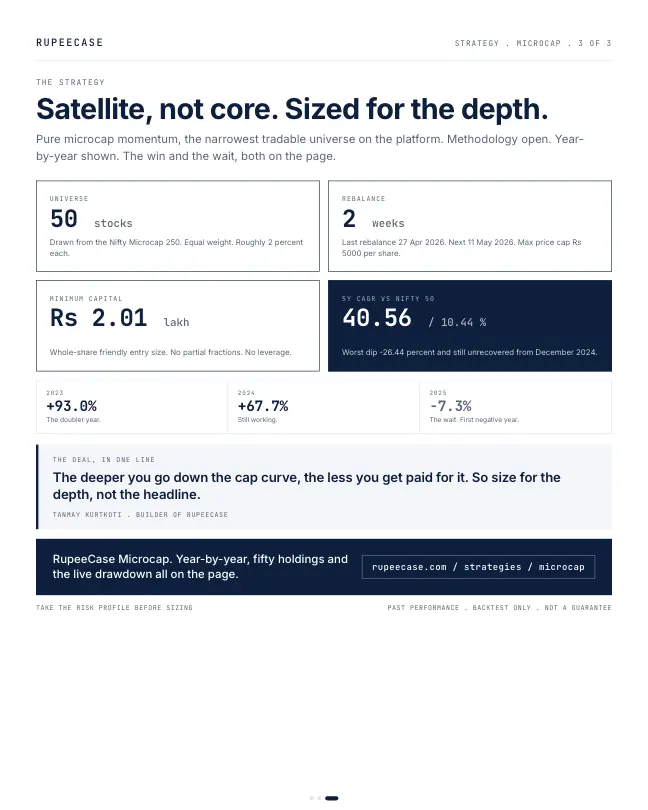
Microcap is a real exposure with a real edge. But it is satellite, not core. Sized for the dip you can actually hold through, not the headline year that doubled the account. The 2023 print was +93 percent. The 2025 print was -7.3 percent. The CAGR assumes you stayed for both.
The deal in one line: the deeper you go, the less you get paid for it. So size for the depth, not the headline
What the cap curve actually is
People say "microcap" as if it were a mood. It is a rank. NSE lines up listed companies by full market capitalisation and cuts the list into bands. The Nifty Midcap 150 holds the companies ranked 101 to 250. The Nifty Smallcap 250 holds ranks 251 to 500. The Nifty Microcap 250 holds the next 250 companies beyond the Nifty 500, chosen on average full market capitalisation, per the NSE Indices factsheets dated 30 Sep 2026. On that date the Smallcap 250 had 251 names and the Microcap 250 had 254, because the bands are reviewed twice a year and a few stocks sit in transition.
So when you step from Smallcap to Microcap you are not buying "more growth". You are buying smaller companies with fewer shares changing hands each day. That is where the extra swing comes from, and the free Learn module on the size factor walks through why liquidity, not company size alone, drives most of it.
The part that rises every time: volatility
Here is what the index factsheets say. Same date, same five year window, price return indices.
- Nifty 5013.82%
- Nifty Midcap 15016.86%
- Nifty Smallcap 25018.58%
- Nifty Microcap 25020.98%
Annualised standard deviation of daily returns, 5 years. NSE Indices factsheets, 30 Sep 2026.
Now the honest twist. On the same factsheets, the five year price CAGR of the Microcap 250 index was 21.06 percent against 13.71 percent for the Smallcap 250. So on the plain indices, in that window, the deeper band did pay more. On the RupeeCase engine, which already picks the stronger names inside each band, the extra return mostly disappeared.
I read that as the real lesson. Volatility went up at every step, on the index and on the model. Return went up on one and flattened on the other. One of those two is reliable. The other depends on the window you happen to measure.
The drawdown ladder, on current model figures
The opening quotes the cards as published in May. Here are the same four strategies on the current lineup, Model, back tested, as of 27 Apr 2026.
- Allcap-22.72%
- Midcap-24.87%
- Smallcap-22.34%
- Microcap-26.43%
Max drawdown. Model, back tested, as of 27 Apr 2026. RupeeCase lineup.json.
The CAGRs moved since May (Allcap 44.70, Smallcap 37.40, Microcap 37.33 percent on the same file), but the shape held. Microcap sits 0.07 points of CAGR below Smallcap and 4.09 points deeper on drawdown. Sharpe is 1.52 against 1.59.
Depth is one half of the pain. Time is the other. On the month end model values, Microcap peaked in Nov 2024 and was still 3.5 percent below that peak at the end of Apr 2026, seventeen months later. The index had its own long wait: the Nifty Microcap 250 closed at 26,411.60 on 11 Dec 2024, fell 26.85 percent to 19,319.95 by 3 Mar 2025 and further, to 18,892.95 on 30 Mar 2026, 28.47 percent below the record, and did not close above that high again until 26 Aug 2026 (NSE daily closes).
Size for the depth: a worked example
Say you have Rs 20,00,000 in equity. You put 20 percent, Rs 4,00,000, in a microcap sleeve and the rest in a broader core.
- A bad stretch arrives. The microcap sleeve falls 26 percent, close to its model worst. That is Rs 1,04,000.
- The core falls 15 percent. On Rs 16,00,000 that is Rs 2,40,000.
- Total loss: Rs 3,44,000, or 17.2 percent of the portfolio.
- To get back, the portfolio needs 17.2 / (100 minus 17.2) = a 20.8 percent gain.
Now push the microcap share to 60 percent with the same falls. The loss becomes Rs 4,32,000, or 21.6 percent, and the climb back needs 27.6 percent. Same markets. Different sizing. The weight decides how deep your hole is, not the label on the sleeve.
The full drawdown recovery calculator adds the time it takes at a given return. If you want the related story on a thematic satellite, the energy basket note runs the same sizing logic on a deeper drawdown.
Questions readers ask
What is the difference between Nifty Smallcap 250 and Nifty Microcap 250?
The Smallcap 250 holds the companies ranked 251 to 500 by full market capitalisation, the bottom half of the Nifty 500. The Microcap 250 holds the next 250 companies beyond the Nifty 500. On the 30 Sep 2026 NSE factsheets the microcap index was more volatile over five years, 20.98 percent against 18.58 percent.
Do microcap stocks always give higher returns than small caps?
No. Over the five years to 30 Sep 2026 the Microcap 250 index did return more than the Smallcap 250, but on the RupeeCase model the two finished almost level (37.33 against 37.40 percent CAGR, Model, back tested, as of 27 Apr 2026) while microcap carried the deeper drawdown. Higher volatility shows up reliably; higher return depends on the period.
How much of a portfolio is usually kept in microcaps?
There is no fixed rule. A practical test is to multiply the sleeve weight by a fall close to its worst drawdown, add the core's fall, and ask whether you would hold through that total. At 20 percent in microcap, a 26 percent microcap fall and a 15 percent core fall take the whole portfolio down about 17 percent.
The cards
3 cards. Swipe, or tap to open.
Explore next
Learn it properly, then see it applied.
- Free module 3.1The Momentum Factor11 min read
- StrategyAllcap strategyNifty Total Market, 50 stocks, every 2 weeks
- Free module 3.5The Size Factor7 min read
- CalculatorDrawdown and recoveryFree, with the formula and a worked example
- StrategyMicrocap strategyNifty Microcap 250, 50 stocks, every 2 weeks
- Blog topicStrategy notes notes22 notes
Related
- Energy Basket: the satellite, not the planetThe Energy Basket pairs the second highest CAGR on the shelf with its deepest drawdown, which is why it only earns a place sized at 5 to 15 percent beside a core.Strategy notes . . 6 min
- Alpha 5: concentration is a position sizeFive equal weight names did nearly fourteen times the index over five years through a 24.72 percent drawdown and 31.68 percent volatility, so size it as a 5 to 15 percent satellite.Strategy notes . . 5 min
- Midcap Smallcap: breadth is not diversificationForty small and mid names dug a deeper hole than the five stock card, 26.17 against 24.72 percent, because forty tickers that fall in the same week are one bet.Strategy notes . . 5 min
Educational content only. Figures are illustrative and computed on historical or representative data for teaching purposes, not investment advice. Past performance does not guarantee future returns. Sourced from NSE, BSE, SEBI, AMFI and RBI public data.