

Strategy notes..5 min read
Alpha 5: concentration is a position size
Five equal weight names did nearly fourteen times the index over five years through a 24.72 percent drawdown and 31.68 percent volatility, so size it as a 5 to 15 percent satellite.
Model, back tested, as of 27 Apr 2026, as published then; the strategy page shows the current figure.
By Tanmay Kurtkoti, founder of QC Alpha and builder of RupeeCase
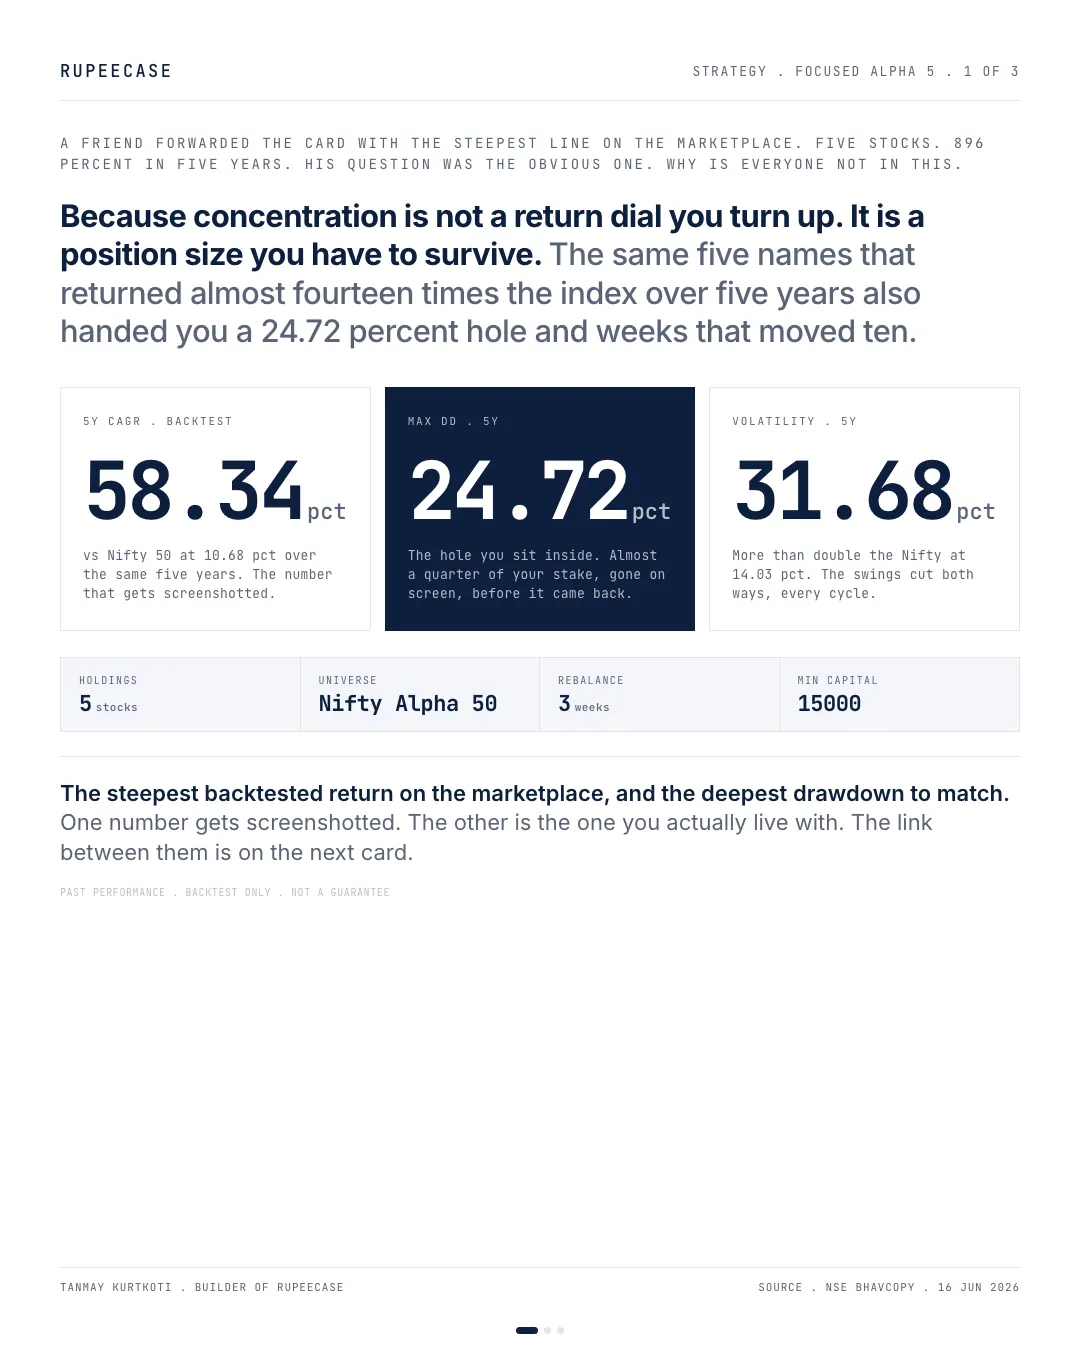
A friend forwarded me a card off the marketplace last week. The one with the steepest line on it. Five stocks, 896 percent over five years against the index's 66. His question was the obvious one. Why is everyone not in this.
Here is the part the screenshot never carries.
The same five names that did nearly fourteen times the index also put you through a 24.72 percent drawdown. Weeks that moved ten percent. Volatility of 31.68, more than double the Nifty. Concentration is not a dial you turn up for more return. It is a position size you have to be able to survive.
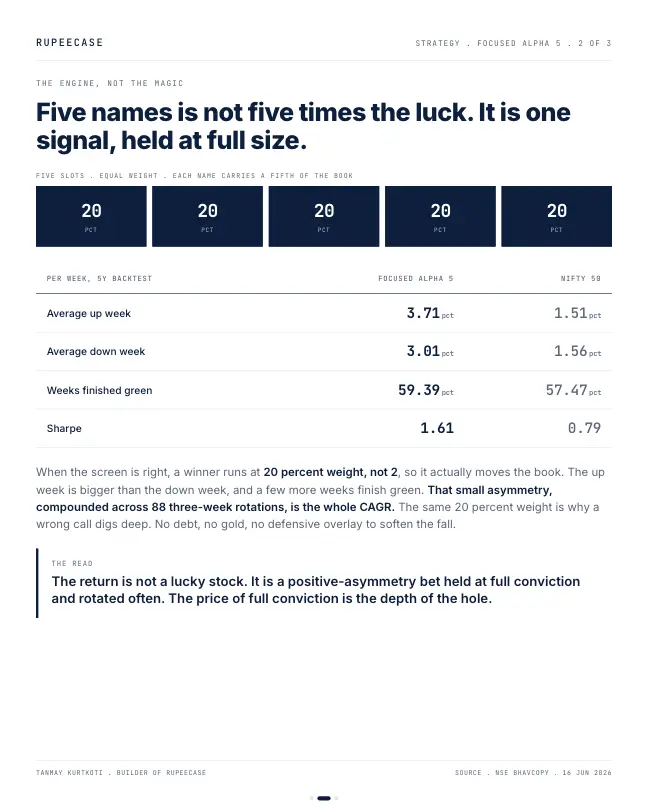
Five names equal weight means every name is a fifth of the book. That is the whole mechanic. When the momentum screen is right, a winner runs at 20 percent weight instead of 2, so it actually moves the portfolio. The average up week comes in at 3.71 percent against the Nifty's 1.51, and a few more weeks finish green. That small asymmetry, rotated eighty-eight times across five years, is the entire CAGR.
And the same 20 percent weight is exactly why a wrong call digs a deep hole. There is no debt sleeve, no gold, no defensive overlay to soften the fall.
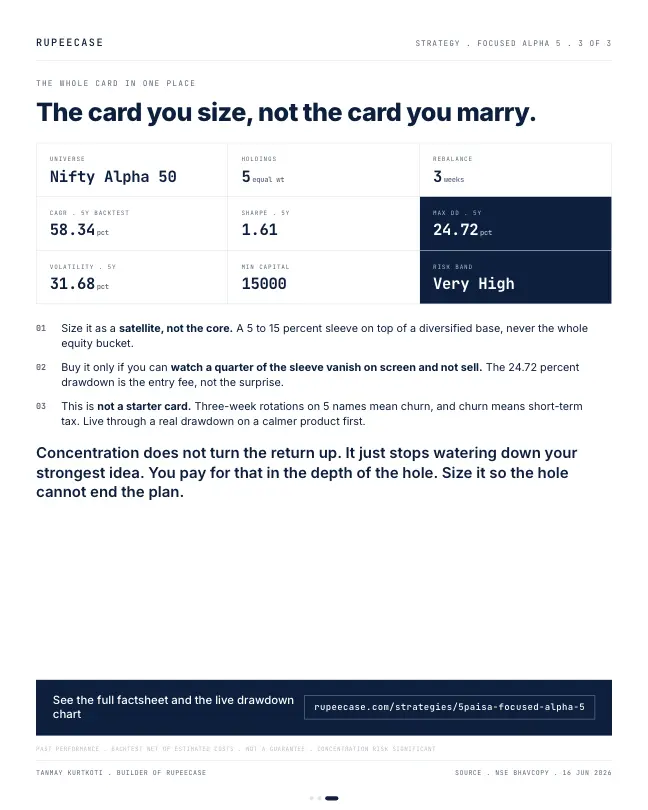
So you size it as what it is. A 5 to 15 percent satellite sleeve on top of a diversified core. Not a starter portfolio. Not the whole equity bucket. And only if you can watch a quarter of that sleeve disappear on screen and keep your hand off the sell button.
Concentration does not make the return. It just stops watering down your strongest idea, and it charges you in drawdown for the privilege. The job is to size it so the hole can never end the plan.
Past performance is backtest, net of estimated costs, not a forecast. Very high risk.
The card on today's factsheet
The opening quotes the figures published on 16 June. The current factsheet for Focused Alpha 5 reads: cumulative return 762.12 percent against 59.62 for the Nifty 50 column, annualised volatility 31.06 percent against 14.04, maximum drawdown 24.18 percent, Sharpe 1.60 (Model, back tested, risk metrics as of 27 Apr 2026). The lineup file puts its CAGR at 54.08 percent, the highest on the shelf (Model, back tested, as of 27 Apr 2026).
- 202277.4%
- 202393.8%
- 2024105.4%
- 2025-1.6%
Focused Alpha 5 calendar year returns from month end values. Model, back tested, RupeeCase nav file, lineup as of 27 Apr 2026.
How the asymmetry adds up
The opening says the whole CAGR comes from a small asymmetry, repeated. Here are its parts from the factsheet. The card wins 62.45 percent of weeks. Its average winning week is plus 3.50 percent; its average losing week is minus 3.28 percent (Model, back tested, risk metrics as of 27 Apr 2026).
Put those together. In a typical stretch of 100 weeks, about 62 or 63 are up by 3.50 percent on average and about 37 or 38 are down by 3.28. On a simple average that is about plus 0.95 percent a week. The wins are barely bigger than the losses. What makes the difference is that there are more of them, and that each one sits at a fifth of the book, so it moves the whole portfolio.
best single week
Model, back tested, factsheet, as of 27 Apr 2026
worst single week
Model, back tested, factsheet, as of 27 Apr 2026
share of weeks that finished up
Model, back tested, factsheet, as of 27 Apr 2026
The rule behind the five
Momentum is the tendency of stocks that have risen strongly over recent months to keep outperforming for a while. A momentum rule ranks stocks on that and holds the leaders. This card runs it at its most concentrated.
- UniverseThe Nifty Alpha 50, an NSE index of 50 stocks with the highest alpha, return above what their market risk explains.
- RankScore all fifty on the momentum rule.
- Hold fiveThe top five, equal weight, 20 percent each.
- Every three weeksRank again; replace any name that fell out of the top.
The rebalance record shows 88 rebalances from 14 May 2021 to 27 Apr 2026 (Model, back tested rebalance record). Starting from a universe that is already the momentum end of the market and holding only five of it is what produces both the 54 percent CAGR and the 31 percent volatility.
A deep hole that closed fast, this time
On the monthly model values, the card peaked at the end of Dec 2024 and was 23.7 percent lower by the end of Feb 2025. It was back above the peak by the end of May 2025. Five months, peak to recovery, much shorter than the broad cards' wait in the same correction. That is worth knowing and not worth relying on. A five stock book can recover fast because five names can turn fast. The same five names can also keep falling, and nothing in the record says which will happen next time.
Sizing it as a satellite
The opening's rule is a 5 to 15 percent sleeve on top of a diversified core. Here is what that means in rupees when the sleeve has its worst fall.
On Rs 20 lakh with a 10 percent sleeve, the worst fall on record takes Rs 48,360 from the sleeve, 2.42 percent of the whole book. At 50 percent it would take Rs 2.42 lakh, 12.1 percent of the book, before the core has fallen at all. The question in the opening, can you watch a quarter of the sleeve disappear, is easier to answer when you know the sleeve's size in rupees first.
The free Learn module on the momentum factor covers how momentum works, why it crashes and the Indian evidence, with a quiz, and the position size calculator sizes any sleeve to your own limit. Related: 5 against 20 against 50 stocks and Energy Basket, the satellite.
Questions readers ask
What is a momentum strategy?
A momentum strategy ranks stocks by how strongly they have risen over recent months and holds the leaders, replacing them as the ranking changes. It rests on the observed tendency of recent winners to keep outperforming for a while, and it can suffer sharp losses when that trend reverses.
Is a five stock portfolio too risky?
It carries more risk per stock: each holding is 20 percent of the book. RupeeCase's five stock model card shows 31.06 percent volatility against 14.04 for the Nifty 50 column and a worst week of minus 10.30 percent (Model, back tested). Whether that suits a reader depends on how large a share of the whole portfolio it is.
How much of a portfolio should a concentrated strategy be?
That depends on the fall you can sit through on the whole book. With a 10 percent sleeve, a 24 percent fall in the sleeve costs about 2.4 percent of the portfolio; with a 50 percent sleeve it costs about 12 percent, before the rest of the portfolio moves.
The cards
3 cards. Swipe, or tap to open.
Explore next
Learn it properly, then see it applied.
- GuideNifty Alpha 50: how the index works and how to invest in itHow NSE picks and weights it, what it returned, and what it costs to hold.
- CalculatorDrawdown and recoveryFree, with the formula and a worked example
- Free module 3.1The Momentum Factor11 min read
- CalculatorPosition size calculatorFree, with the formula and a worked example
- Strategy5Paisa Focused Alpha 5 strategyNifty Alpha 50, 5 stocks, every 3 weeks
- Blog topicStrategy notes notes22 notes
Related
- Midcap Smallcap: breadth is not diversificationForty small and mid names dug a deeper hole than the five stock card, 26.17 against 24.72 percent, because forty tickers that fall in the same week are one bet.Strategy notes . . 5 min
- Microcap: the deeper you goStepping from Allcap to Microcap on the same engine flattens the return and widens the drawdown, so the cap curve is a drawdown ladder dressed up as a return ladder.Strategy notes . . 6 min
- Energy Basket: the satellite, not the planetThe Energy Basket pairs the second highest CAGR on the shelf with its deepest drawdown, which is why it only earns a place sized at 5 to 15 percent beside a core.Strategy notes . . 6 min
Educational content only. Figures are illustrative and computed on historical or representative data for teaching purposes, not investment advice. Past performance does not guarantee future returns. Sourced from NSE, BSE, SEBI, AMFI and RBI public data.