

Strategy notes..6 min read
Energy Basket: the satellite, not the planet
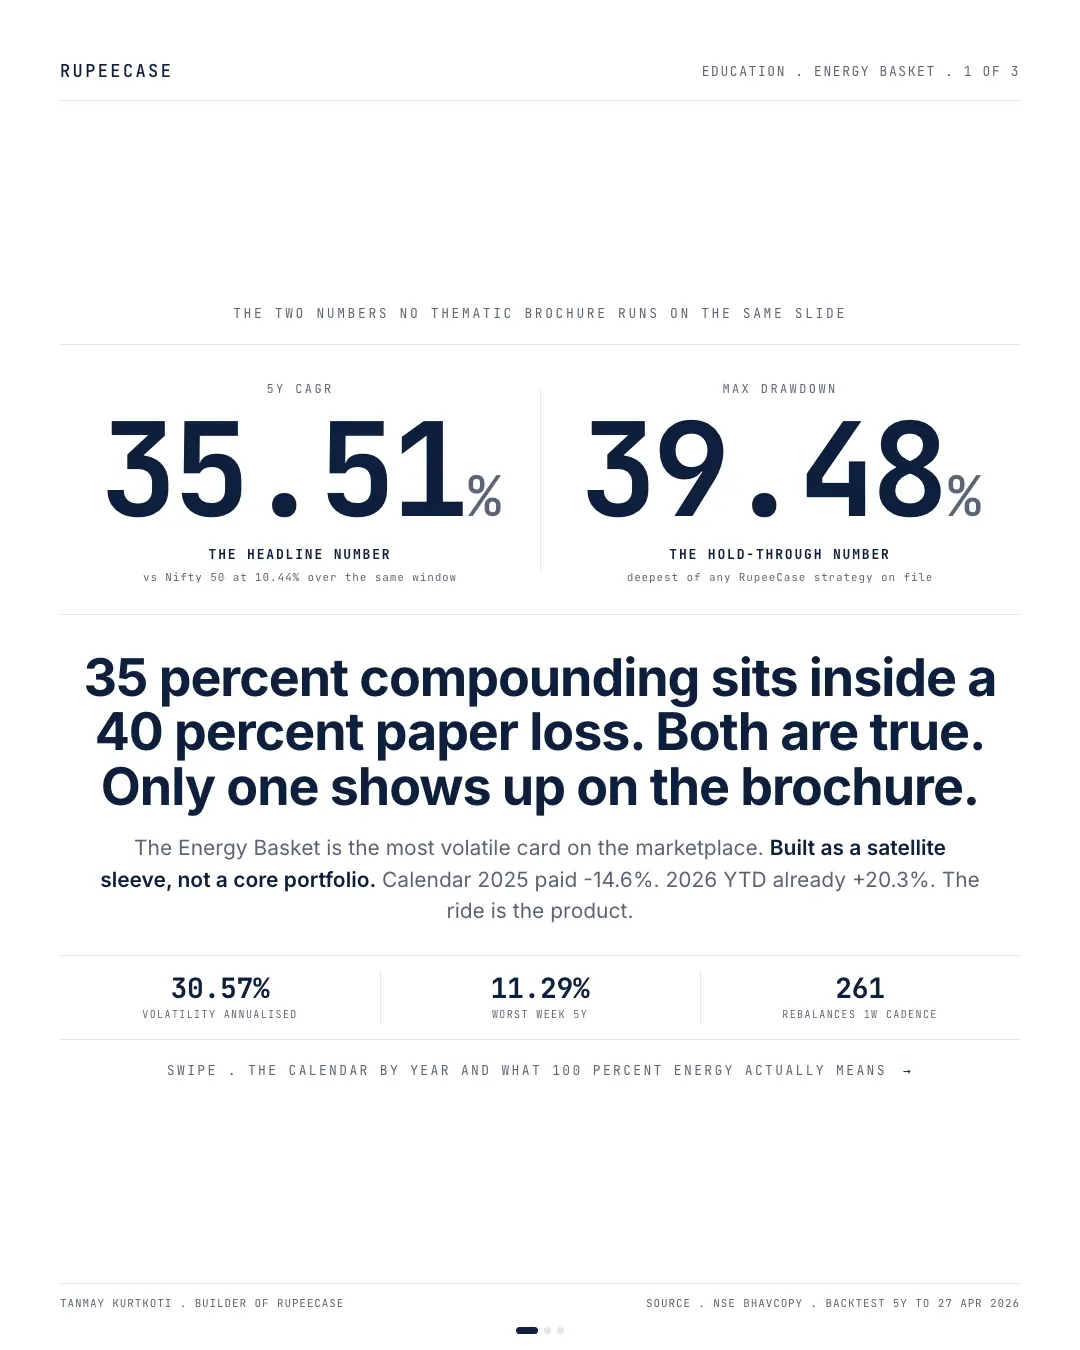
The Energy Basket pairs the second highest CAGR on the shelf with its deepest drawdown, which is why it only earns a place sized at 5 to 15 percent beside a core.
Model, back tested, as of 27 Apr 2026, as published then; the strategy page shows the current figure.
By Tanmay Kurtkoti, founder of QC Alpha and builder of RupeeCase
Saturday evening I am sitting with the Energy Basket factsheet open. Most volatile card on the RupeeCase marketplace. Highest CAGR after the 5-stock Alpha 5. Deepest drawdown of any strategy on file (16 cards then, 18 today).
The brochure number is 35.51 percent CAGR over five years. The hold-through number is a -39.48 percent max drawdown. Both numbers are true. Most thematic brochures put the first one on slide one and the second one on a footnote thirty pages in. Worth running them on the same page.
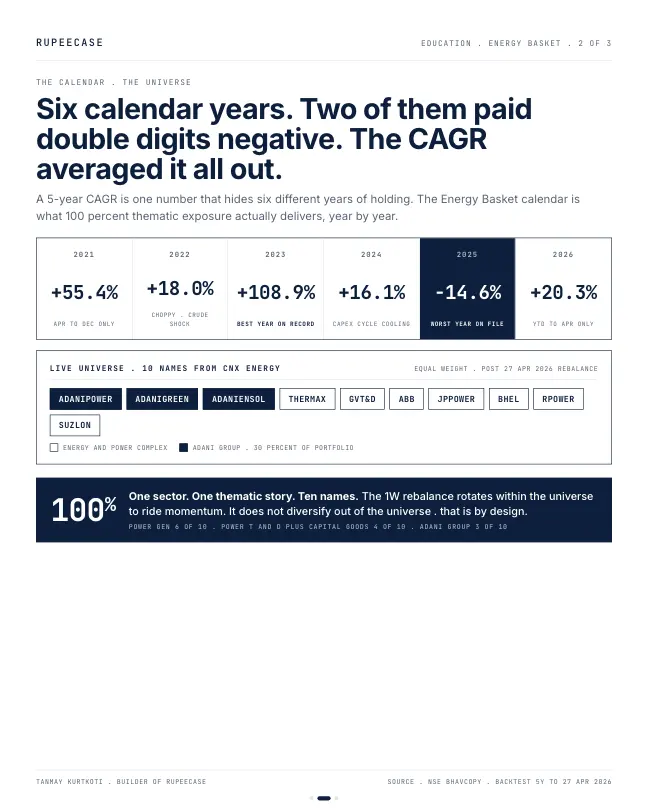
Six calendar years of holding tells you what the CAGR averaged out. 2021 paid 55 percent April to December. 2022 was choppy at 18 percent through a crude shock. 2023 was the ride . plus 108.9 percent on the back of the energy and capex cycle. 2024 cooled to 16. Then 2025 paid minus 14.6 percent, the deepest calendar year of any strategy on file, double the next-worst. 2026 YTD is already plus 20.3 percent, the strongest on the marketplace. The full year-by-year is in the factsheet at rupeecase.com/strategies/energy-basket and the rule book that drives the 1W rotation is at rupeecase.com/strategies/methodology .
Here is the part the headline number hides. The 1W rebalance rotates within the universe. It does not diversify out of it. The card is 100 percent energy and power by design. Three of ten holdings are Adani group, 30 percent of the portfolio in one corporate house. Six of ten are power generation. If the energy capex cycle turns, rotation does not save the basket . that is the universe taking the hit, not the picks.
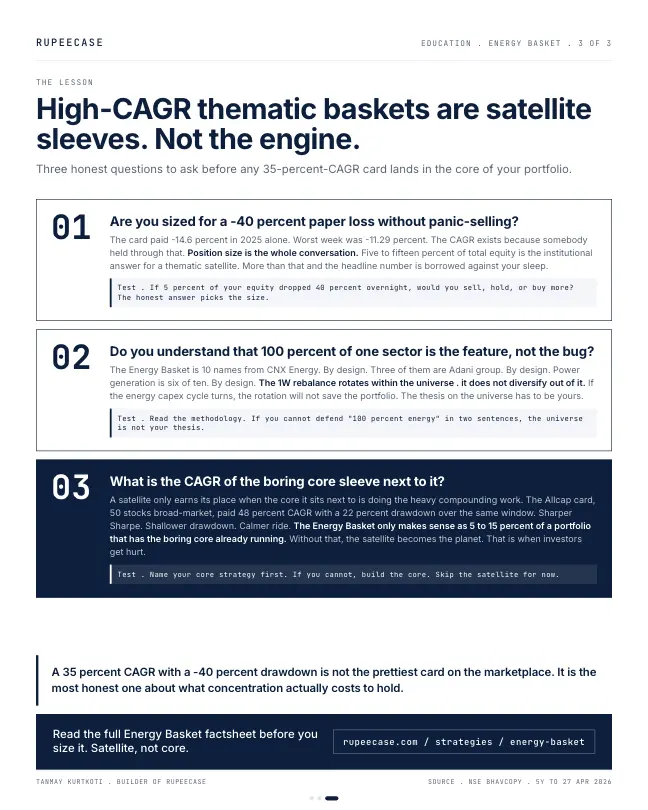
Compare against the boring core sleeve next to it. The 50-stock broad-market Allcap at rupeecase.com/strategies/allcap paid 48 percent CAGR with a 22.7 percent max drawdown over the same window. Sharper Sharpe ratio. Shallower drawdown. Calmer ride. That is what a core sleeve looks like in numbers.
The Energy Basket only earns its place sized at 5 to 15 percent of total equity, sat next to a core that is doing the compounding work. Without that core, the satellite becomes the planet. That is when investors get hurt by the same number that drew them in.
Honest version. A 35 percent CAGR with a -40 percent drawdown is not the prettiest card on the marketplace. It is the most honest one about what concentration actually costs to hold. Drawdown as a concept lives at rupeecase.com/learn/ if you want the math. The behavioral fit . the sizing question . starts at rupeecase.com/risk-profile . The full lineup, 18 cards today, sits at rupeecase.com/strategies/ for comparison.
The two cards on today's figures
The opening quotes the figures published on 2 May. Here are the two cards from the current lineup file, so the comparison is on one date. Energy Basket: 33.12 percent CAGR, Sharpe 1.12, maximum drawdown 39.48 percent. Allcap: 44.70 percent CAGR, Sharpe 1.68, maximum drawdown 22.72 percent (Model, back tested, as of 27 Apr 2026). On these numbers the broad card earned more and fell less. The satellite is not there for a higher return. It is there for a different one.
Both model cards grew several times over five years; Energy Basket took the sharper fall from late 2024 to early 2025.
The benchmark line in that chart is a smoothed CAGR line for the Nifty 50 TRI, not the daily index, so read it as the average pace, not the path. The two strategy lines are the monthly model values.
Year by year, the satellite swings wider
- 202218.0%
- 2023108.8%
- 202416.1%
- 2025-14.6%
Energy Basket calendar year returns. Model, back tested, RupeeCase factsheet of 13 May 2026.
One year in four did most of the work. That is the shape of a thematic card: a narrow universe that is either in favour or not. The factsheet puts its annualised volatility at 30.47 percent against 14.04 for the Nifty 50, and its share of winning weeks at 55.56 percent, slightly below the index's 57.47 (Model, back tested, risk metrics as of 27 Apr 2026). It does not win more often. It wins bigger when it wins.
The weekly rotation shows in the rebalance record: 262 rebalances from 14 May 2021 to 11 May 2026 (Model, back tested rebalance record). Rotating that often keeps the ten names on trend inside energy and power. It cannot move the card out of energy and power, which is the opening's point.
Sizing it: what 10 percent adds to the hole
The useful question is not how deep the satellite falls. It is how much deeper it makes your whole book fall. Both cards had their worst stretch in the same months: on the monthly model values, both troughed in Feb 2025. So treat the two drawdowns as arriving together.
Take Rs 10 lakh of equity. Put Rs 9 lakh in a core that falls 22.72 percent and Rs 1 lakh in a satellite that falls 39.48 percent. The book falls 0.9 × 22.72 + 0.1 × 39.48 = about 24.4 percent, Rs 2.44 lakh. The core alone would have fallen Rs 2.27 lakh. A 10 percent satellite added about Rs 17,000 to the worst month of the cycle.
Move the share to 15 percent and the book falls about 25.2 percent. Move it to 50 percent, the satellite as half the book, and it falls about 31.1 percent. That is the moment the satellite becomes the planet. The 5 to 15 percent band in the opening keeps the extra hole to a point or two.
The checklist I run on any thematic card
- UniverseWhat is the card allowed to own? Energy Basket: 10 names from one sector index.
- Worst yearWhat did a full calendar year cost? Here, minus 14.6 percent in 2025.
- Worst fallPeak to trough: 39.48 percent.
- Share of bookSize it so the whole book's fall stays one you can sit through.
The minimum to run the card is small, Rs 64,836 on the factsheet of 13 May 2026, which makes it easy to size as a slice rather than the whole. That is also what makes it easy to oversize.
The free Learn module on position sizing works through fixed fraction and risk based sizing with a quiz, and the position size calculator applies it to your own numbers. Related: 5 against 20 against 50 stocks and the Allcap spotlight.
Questions readers ask
How much of a portfolio should go into a thematic strategy?
There is no single right figure; it depends on how deep a fall you can hold. The arithmetic is simple: if the core falls 22.72 percent and the theme falls 39.48 percent at the same time, a 10 percent theme takes the whole book's fall to about 24.4 percent, and a 50 percent theme to about 31.1 percent.
What is a core and satellite portfolio?
A core is a broad, diversified holding that does most of the compounding; satellites are smaller, narrower positions such as a sector or theme. The satellite can add return in its good years, and its size decides how much of its bad years reaches the whole portfolio.
Why does a sector strategy fall more than a broad one?
Because all its holdings share one driver. A weekly rotation inside one sector picks the stronger names in that sector, but if the sector itself turns, every name is exposed to the same shock. A broad universe spreads the book across drivers that do not all turn at once.
The cards
3 cards. Swipe, or tap to open.
Explore next
Learn it properly, then see it applied.
- Free module 3.1The Momentum Factor11 min read
- Free module 4.2Position Sizing8 min read
- CalculatorPosition size calculatorFree, with the formula and a worked example
- StrategyEnergy Basket strategyCNX Energy, 10 stocks, every week
- StrategyAllcap strategyNifty Total Market, 50 stocks, every 2 weeks
- Blog topicStrategy notes notes22 notes
Related
- Microcap: the deeper you goStepping from Allcap to Microcap on the same engine flattens the return and widens the drawdown, so the cap curve is a drawdown ladder dressed up as a return ladder.Strategy notes . . 6 min
- Alpha 5: concentration is a position sizeFive equal weight names did nearly fourteen times the index over five years through a 24.72 percent drawdown and 31.68 percent volatility, so size it as a 5 to 15 percent satellite.Strategy notes . . 5 min
- Midcap Smallcap: breadth is not diversificationForty small and mid names dug a deeper hole than the five stock card, 26.17 against 24.72 percent, because forty tickers that fall in the same week are one bet.Strategy notes . . 5 min
Educational content only. Figures are illustrative and computed on historical or representative data for teaching purposes, not investment advice. Past performance does not guarantee future returns. Sourced from NSE, BSE, SEBI, AMFI and RBI public data.