

Strategy notes..5 min read
Focused Largecap 20: twenty sized bets on a factsheet
Twenty equal weight Nifty 100 names on a four week cadence printed 27.40 percent CAGR with a 27.23 percent drawdown, and the multi asset twin nearly matched its Sharpe.
Model, back tested, as of 27 Apr 2026, as published then; the strategy page shows the current figure.
By Tanmay Kurtkoti, founder of QC Alpha and builder of RupeeCase
This morning we wrote about position sizing. Full Kelly is a graveyard with the right tombstone math. Half Kelly is the practitioner default. A hundred pct equity SIP is already roughly quarter Kelly by design, not by accident. The math is clean. The portfolio it produces is the harder part.
Monday evening, here is what that sizing logic looks like on a live factsheet.
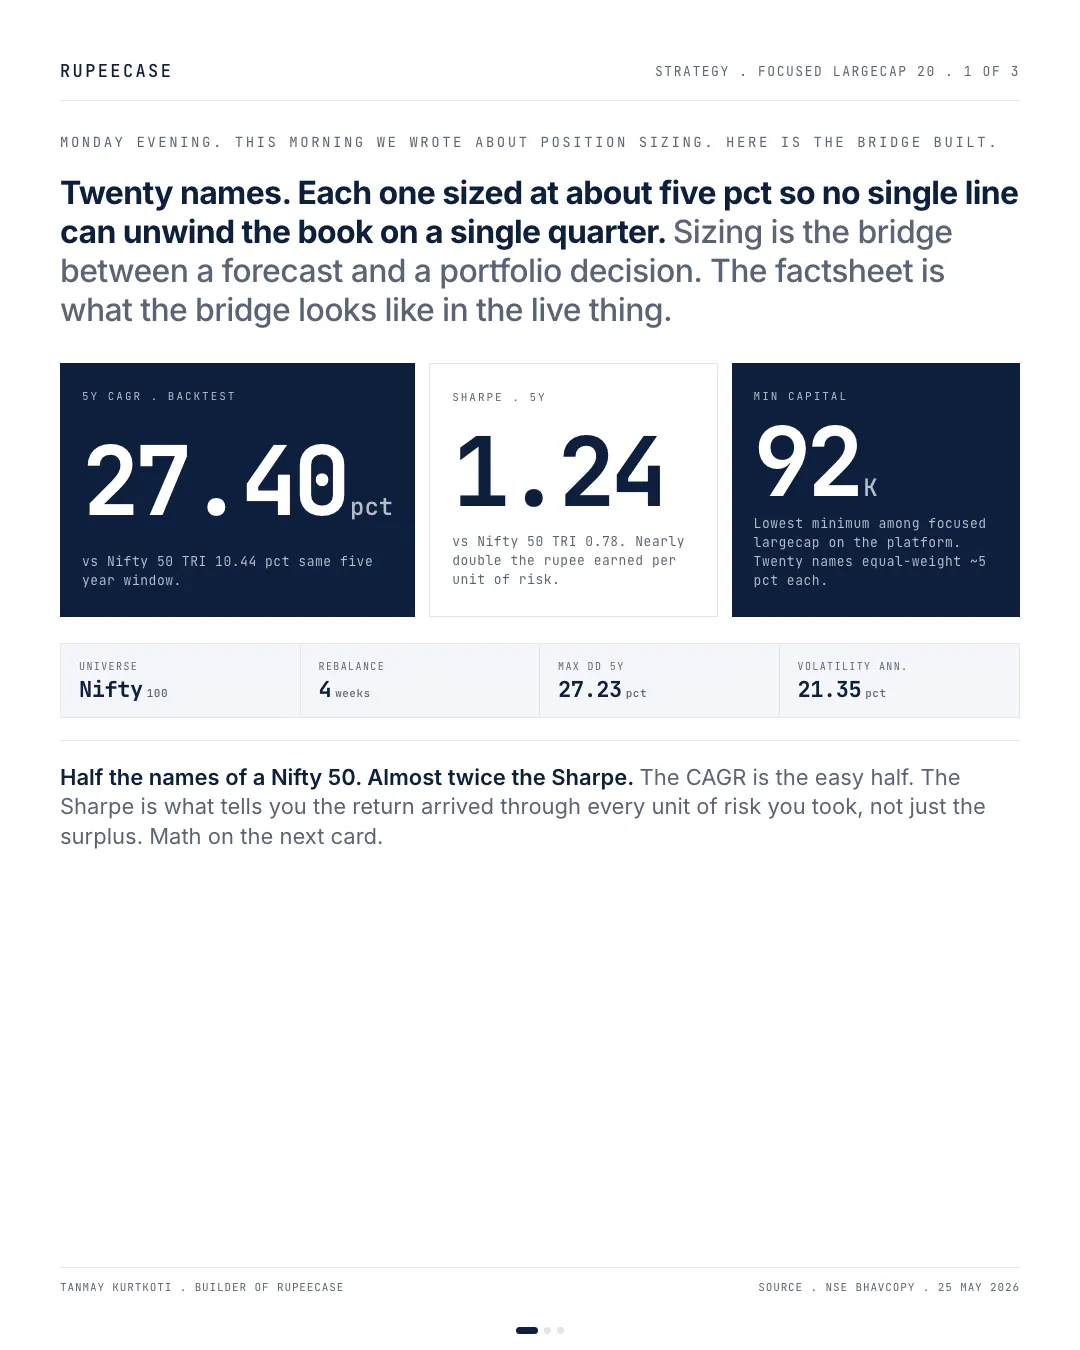
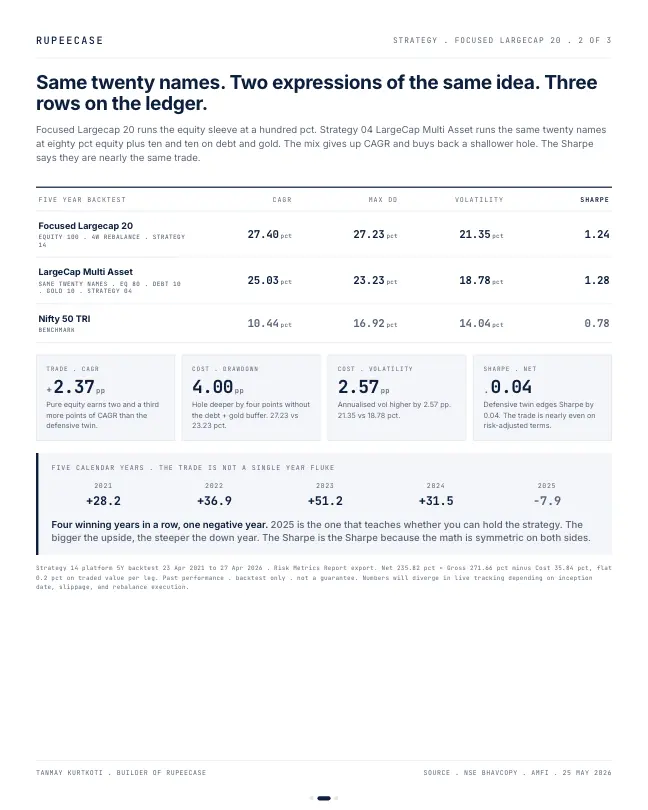
Strategy 14 picks twenty names from the Nifty 100, equal-weight at about five pct each, rebalanced every four weeks. Twenty momentum picks under a five thousand rupee stock price cap. Five year backtest prints 27.40 pct CAGR against the Nifty 50 TRI at 10.44 pct. Sharpe nearly doubles, 1.24 against 0.78. Max drawdown is a different story. 27.23 pct against the Nifty's 16.92 pct, so the hole is deeper by more than ten points. Volatility 21.35 against 14.04. The Sharpe survives both because the return is paid by every unit of risk you took, not just the surplus.
The defensive twin sits next door. Same twenty names, same four week rebalance, but eighty pct equity, ten pct LIQUIDCASE, ten pct GOLDBEES on top. That sleeve runs 25.03 pct CAGR, Sharpe 1.28, max DD 23.23 pct. The Sharpe is fractionally higher on the mix. The CAGR is two and a third points lower. Two ways of expressing the same twenty-stock idea. The Sharpe says they are nearly the same trade. Pick by what depth of hole you can SIP through, not by the bigger CAGR line.
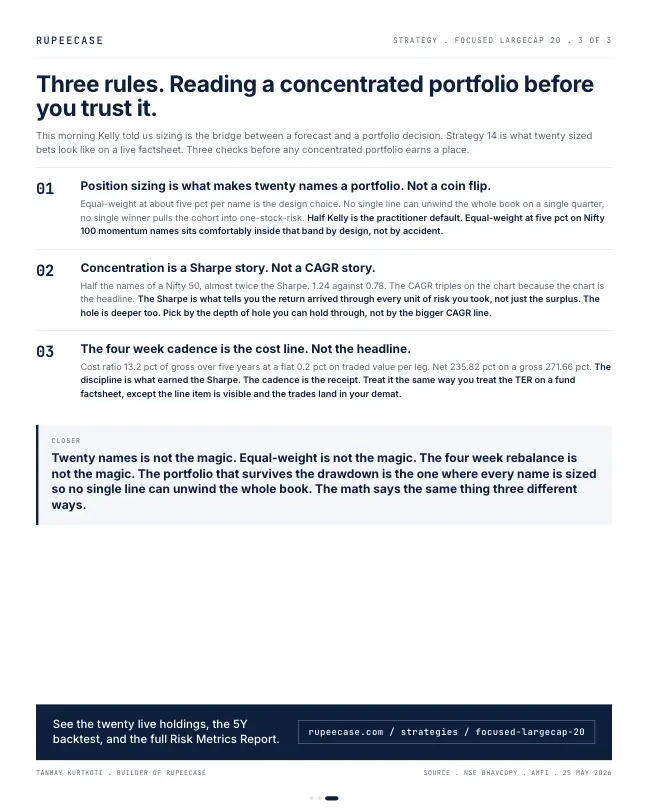
Three rules I keep coming back to. Position sizing is what makes twenty names a portfolio and not a coin flip. Concentration is a Sharpe story, not a CAGR story. The four week cadence is the cost line, not the headline, and thirteen pct of gross over five years is the receipt for the discipline
The two cards on today's file
The opening quotes the figures published on 25 May. On the current lineup file, Focused Largecap 20 shows 26.29 percent CAGR, a Sharpe ratio of 1.20 and a maximum drawdown of 23.56 percent. Its 80, 10, 10 sibling, Large Cap Multi Asset, shows 24.36 percent, 1.32 and 20.96 percent (Model, back tested, as of 27 Apr 2026). The same reading holds: the mix gives up about two points of CAGR and buys a higher Sharpe and a shallower hole.
- Focused Largecap 20-23.56%
- Large Cap Multi Asset-20.96%
Maximum drawdown. Model, back tested, as of 27 Apr 2026. RupeeCase lineup.json.
Sizing inside the twenty
Position sizing works at two levels, and this card shows both. Inside the strategy, every stock is about 5 percent of the book. On Rs 1,00,000 that is about Rs 5,000 a stock, which is why the rule caps share prices at Rs 5,000 and why the factsheet's minimum capital is Rs 95,515 (Model, back tested, factsheet of 13 May 2026). A higher priced share could not be bought at its weight.
weight of each of the twenty stocks
Strategy rules, equal weight
of the book lost if one stock falls 30 percent
Worked example
worst single week on the factsheet
Model, back tested, risk metrics as of 13 Jul 2026
At 5 percent a name, no single company can sink the book. One stock falling 30 percent costs 1.5 percent. That is the sense in which sizing turns twenty names into a portfolio: each bet is big enough to matter and small enough to survive being wrong.
Sizing the whole card: the Kelly idea
The second level is how much of your money goes into the card at all. The Kelly criterion, which the opening refers to, gives a formula for the fraction of capital that maximises long run growth. For a return stream with expected return, risk free rate and volatility, the full Kelly fraction is the excess return divided by the variance.
Read the output carefully. Fed the back tested numbers, full Kelly says to hold about 4.5 times your capital in the card, with borrowed money. That is the graveyard the opening mentions. The formula assumes you know the true expected return and volatility. You do not: you know a five year back test. Overestimate the return a little and full Kelly sizes you into ruin.
Put the Nifty 50 column from the same factsheet into the calculator, 9.17 percent and 14.15 percent volatility, and full Kelly comes out near 1.6 times capital. With these inputs, 100 percent in the index sits at a bit over half Kelly; with a higher risk free rate or a lower expected return it slides toward quarter Kelly. The fraction is that sensitive to its inputs, which is exactly why practitioners halve it and then halve it again.
MythFull Kelly is the best size, so getting close to it is the goal.
FactOnly if you know the true return and risk. With estimates, full Kelly overbets. Half or quarter Kelly gives up a little growth for a much smaller drawdown.
What the cushion does to the same idea
The defensive twin applies sizing at the asset level instead. It keeps 80 percent in the twenty stocks and puts 10 percent each into debt and gold. In Kelly terms, it is a smaller bet on the same edge, with two sleeves that move differently from stocks. The result on the file is a lower CAGR, a higher Sharpe and a hole 2.6 points shallower.
The cost line falls too. The Focused Largecap 20 factsheet's cost decomposition shows a gross return of 284.27 percent, an estimated cost of 35.19 points and a net of 249.08 percent (Model, back tested, cost decomposition as of 13 Jul 2026): about 1.9 percent a year of drag over roughly five years, lower than the two week cards because it trades every four weeks.
The free Learn module on position sizing works through fixed fraction, volatility and Kelly sizing with a quiz, and the position size calculator applies them to your own numbers. Related: 5 against 20 against 50 stocks and Largecap Hybrid, a buffer is a shock absorber.
Questions readers ask
What is the Kelly criterion in investing?
It is a formula for the fraction of capital that maximises long run growth given a known edge. For a return stream it is the expected excess return divided by the variance. Because the true return and volatility are never known, practitioners usually use half or quarter of the full Kelly fraction.
How much should one stock be in a portfolio?
There is no single right figure. An equal weight portfolio of twenty stocks holds 5 percent in each, so a 30 percent fall in one stock costs 1.5 percent of the book. Larger positions raise both the gain from a good idea and the cost of a bad one.
Why does adding debt and gold raise the Sharpe ratio?
Debt and gold tend to move differently from stocks, so a portfolio with some of each swings less than the stock part alone, while giving up only part of the return. On RupeeCase's large cap cards, the 80, 10, 10 version shows a Sharpe of 1.32 against 1.20 for pure equity (Model, back tested, as of 27 Apr 2026).
The cards
3 cards. Swipe, or tap to open.
Explore next
Learn it properly, then see it applied.
- Free module 3.1The Momentum Factor11 min read
- StrategyLarge Cap Multi Asset strategyNifty 100, 22 stocks, every 4 weeks
- Free module 4.2Position Sizing8 min read
- CalculatorPosition size calculatorFree, with the formula and a worked example
- StrategyFocused Largecap 20 strategyNifty 100, 20 stocks, every 4 weeks
- Blog topicStrategy notes notes22 notes
Related
- The cadence question: why two weeksRupeeCase Large Midcap rebalanced 131 times in five years at a 14 day average gap, a cadence chosen to stop a momentum signal rotting without paying quarterly latency.Strategy notes . . 5 min
- Smallcap: the honest yearThe RupeeCase Smallcap backtest shows four easy years and one awful one, and the 41 percent CAGR only belongs to the investor who held through 2025.Strategy notes . . 6 min
- Sharpe ratio, decoded on a live cardAllcap Multi Asset earned 4.1 times the Nifty's CAGR for 1.5 times its volatility, which is what a Sharpe of 1.79 against 0.79 means in plain numbers.Strategy notes . . 5 min
Educational content only. Figures are illustrative and computed on historical or representative data for teaching purposes, not investment advice. Past performance does not guarantee future returns. Sourced from NSE, BSE, SEBI, AMFI and RBI public data.