

Strategy notes..5 min read
The cadence question: why two weeks
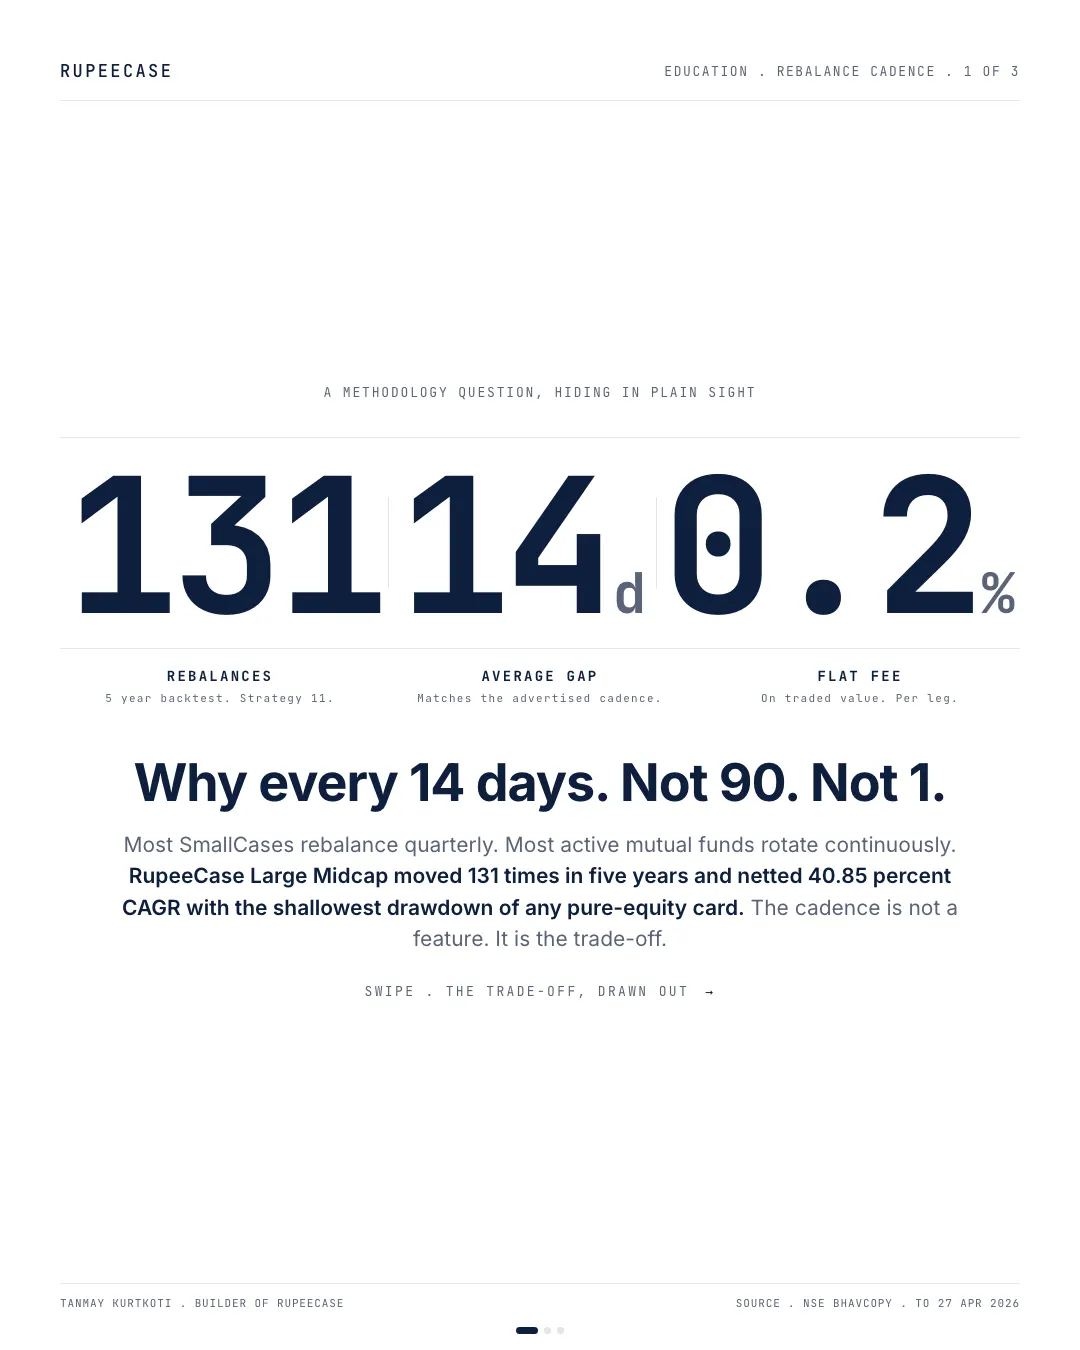
RupeeCase Large Midcap rebalanced 131 times in five years at a 14 day average gap, a cadence chosen to stop a momentum signal rotting without paying quarterly latency.
Model, back tested, as of 27 Apr 2026, as published then; the strategy page shows the current figure.
By Tanmay Kurtkoti, founder of QC Alpha and builder of RupeeCase
Pulled the rebalance log on RupeeCase Large Midcap this week. The strategy moved 131 times in five years. Average gap, 14.0 days. No drift from the advertised cadence.
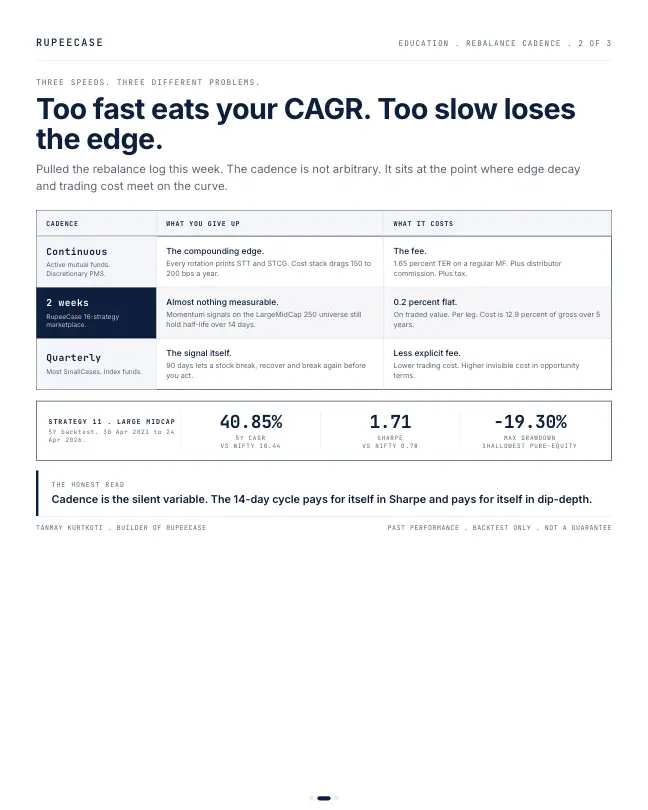
Most active mutual funds rotate continuously. Every rotation prints STT, STCG and brokerage. Stack 1.65 percent TER on top, plus the distributor commission inside the regular plan, and the cost drag lands somewhere between 150 and 200 basis points a year. The plain-English version of the cost stack sits at rupeecase.com/compare
Most model basket products sit on a quarterly cadence. Lower trading cost, but 90 days is a long time to leave a momentum signal to rot. A stock can break, recover and break again before the rebalance fires.
The 14-day cadence is the middle of the curve. Edge decay on the LargeMidCap 250 universe still has half-life over a fortnight. Cost is contained at 0.2 percent flat per leg of traded value, which works out to 12.9 percent of gross over five years on Strategy 11. The methodology that produced this is open at rupeecase.com/strategies/methodology
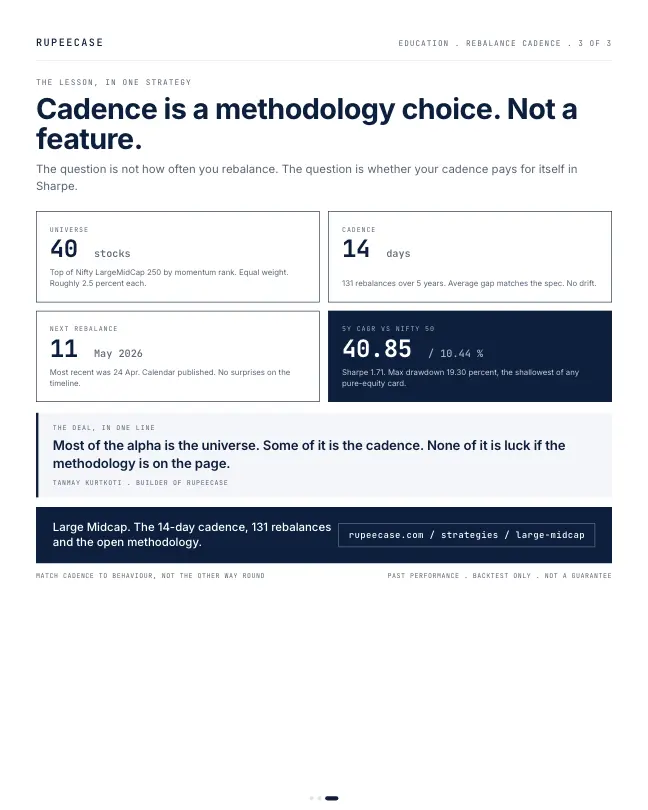
Strategy 11 is the cleanest evidence that the cadence pays for itself. Five-year CAGR sits at 40.85 percent versus 10.44 percent for Nifty 50 over the same window. Sharpe 1.71 versus 0.78. Max drawdown -19.30 percent, the shallowest of any pure-equity card on the platform.
The cadence does not make those numbers on its own. The universe and the momentum rule do most of the work. What the 14-day cycle does is stop the rule from rotting. Most of the alpha is the universe. Some of it is the cadence. None of it is luck if the methodology is on the page.
For the concept-level version of edge decay, half-life and rebalance cost theory, the explainer is at rupeecase.com/learn/
The full Strategy 11 page with the 131 rebalance history, the 14-day calendar, the next move (11 May 2026 at the time of writing) and the open methodology lives at rupeecase.com/strategies/large-midcap
Before sizing into a 21 percent volatility pure-equity card, the behavioural-fit gate is at rupeecase.com/risk-profile
Cadence is a methodology choice. Not a feature.
The record behind the cadence
The opening counts the rebalances; here is the same check on today's file. The Large Midcap rebalance record lists 132 rebalances from 14 May 2021 to 11 May 2026, an average gap of 13.9 days (Model, back tested rebalance record). The current lineup shows the card at 37.83 percent CAGR, Sharpe 1.69 and a maximum drawdown of 19.31 percent, still the shallowest of the pure equity momentum cards (Model, back tested, as of 27 Apr 2026).
rebalances, May 2021 to May 2026
Model, back tested rebalance record, Large Midcap
average gap between them
Model, back tested rebalance record, Large Midcap
maximum drawdown
Model, back tested, as of 27 Apr 2026
What happens on a rebalance day
A fixed cadence only means something if the steps are fixed too. On each firing the rule does the same five things, in the same order.
- RankScore every stock in the Nifty LargeMidCap 250 on the momentum rule, on the same closing prices.
- SelectThe top 40 make the new list.
- CompareNames that dropped out are sold. Names that came in are bought.
- ReweightBack to equal weight, about 2.5 percent each.
- PublishThe trade list goes out, and the clock starts for the next fortnight.
That matters for cost. Names that stay on the list are not sold; only the names that change are traded, plus the small trims that bring winners back to equal weight.
The trade off, drawn as a dial
Every cadence sits somewhere between two costs. Rebalance too rarely and the signal goes stale: a stock that was strong at the last firing may have broken weeks ago and still sit in the book. Rebalance too often and you pay STT, stamp duty and charges on trades that barely change anything.
- Weekly, sector baskets52
- Every 2 weeks, most cards26
- Every 3 weeks, Alpha 517
- Every 4 weeks, large caps13
- Quarterly, for comparison4
Rebalance cadences from RupeeCase lineup.json, as of 27 Apr 2026. Quarterly is a reference point, not a card.
Two weeks is not a magic number. It is a choice the back test supports for this universe: large and mid caps trade enough that a fortnightly rotation does not move prices much, and momentum in them does not usually reverse within days. A smaller, less liquid universe would pay more per trade and might choose a slower dial.
Reading the cost line as a yearly rate
The factsheet prints what the cadence cost, in its cost decomposition. For Large Midcap: a gross return of 509.05 percent before costs, an estimated cost of 66.53 percentage points, and a net return of 442.52 percent (Model, back tested, cost decomposition as of 27 Apr 2026). That cost is about 13 percent of the gross gain, close to the opening's figure.
Turning it into a yearly rate makes it comparable with an expense ratio. A gross multiple of 6.09 times against a net multiple of 5.43 times over about five years means the costs took about 2.3 percent a year.
About 2.3 percent a year is a real bill, larger than many fund expense ratios. It is paid in exchange for a return that the back test shows well above the index after the bill. Whether that trade suits a reader is a judgement about the strategy, not about the cadence alone. What the fixed cadence gives you is a bill you can see in advance and check afterwards.
The free Learn module on rebalancing strategies compares calendar, threshold and signal based rebalancing with their costs, with a quiz, and the rebalance cost calculator estimates the bill for your own cadence. Related: recipe against paragraph and Large Midcap, when the return is a tie.
Questions readers ask
How often should a momentum portfolio be rebalanced?
There is no single answer; it is a trade off between a stale signal and trading costs. Faster rebalancing keeps the holdings closer to the current signal but pays charges more often. The RupeeCase cards range from weekly for sector baskets to every four weeks for the large cap cards (Model, back tested, as of 27 Apr 2026).
How much do rebalancing costs reduce returns?
On the Large Midcap model card, the factsheet's cost decomposition shows 509.05 percent gross against 442.52 percent net over about five years, a drag of about 2.3 percent a year (Model, back tested, as of 27 Apr 2026). The figure depends on how many names change at each rebalance and the cost of each trade.
Why not rebalance once a quarter to save costs?
Fewer rebalances cut the cost bill, but the signal ages between them. Over 90 days a momentum stock can turn and stay in the book. Whether the saving outweighs the stale signal depends on the universe and the rule, which is what a back test across cadences tests.
The cards
3 cards. Swipe, or tap to open.
Explore next
Learn it properly, then see it applied.
Related
- Large Midcap: when the return is a tie, the drawdown decidesLarge Midcap, Smallcap and Microcap all printed about 41 percent, with holes of 19.30, 22.35 and 26.44 percent, and only the first finished 2025 up.Strategy notes . . 5 min
- Smallcap: the honest yearThe RupeeCase Smallcap backtest shows four easy years and one awful one, and the 41 percent CAGR only belongs to the investor who held through 2025.Strategy notes . . 6 min
- Sharpe ratio, decoded on a live cardAllcap Multi Asset earned 4.1 times the Nifty's CAGR for 1.5 times its volatility, which is what a Sharpe of 1.79 against 0.79 means in plain numbers.Strategy notes . . 5 min
Educational content only. Figures are illustrative and computed on historical or representative data for teaching purposes, not investment advice. Past performance does not guarantee future returns. Sourced from NSE, BSE, SEBI, AMFI and RBI public data.