

Strategy notes..5 min read
Allcap Multi Asset: the better Sharpe is the mix
The 80/10/10 version of Allcap gave up 4.45 points of CAGR for a shallower hole, 98 fewer days underwater and a 2025 loss cut from 4.1 to 1.7 percent.
Model, back tested, as of 27 Apr 2026, as published then; the strategy page shows the current figure.
By Tanmay Kurtkoti, founder of QC Alpha and builder of RupeeCase
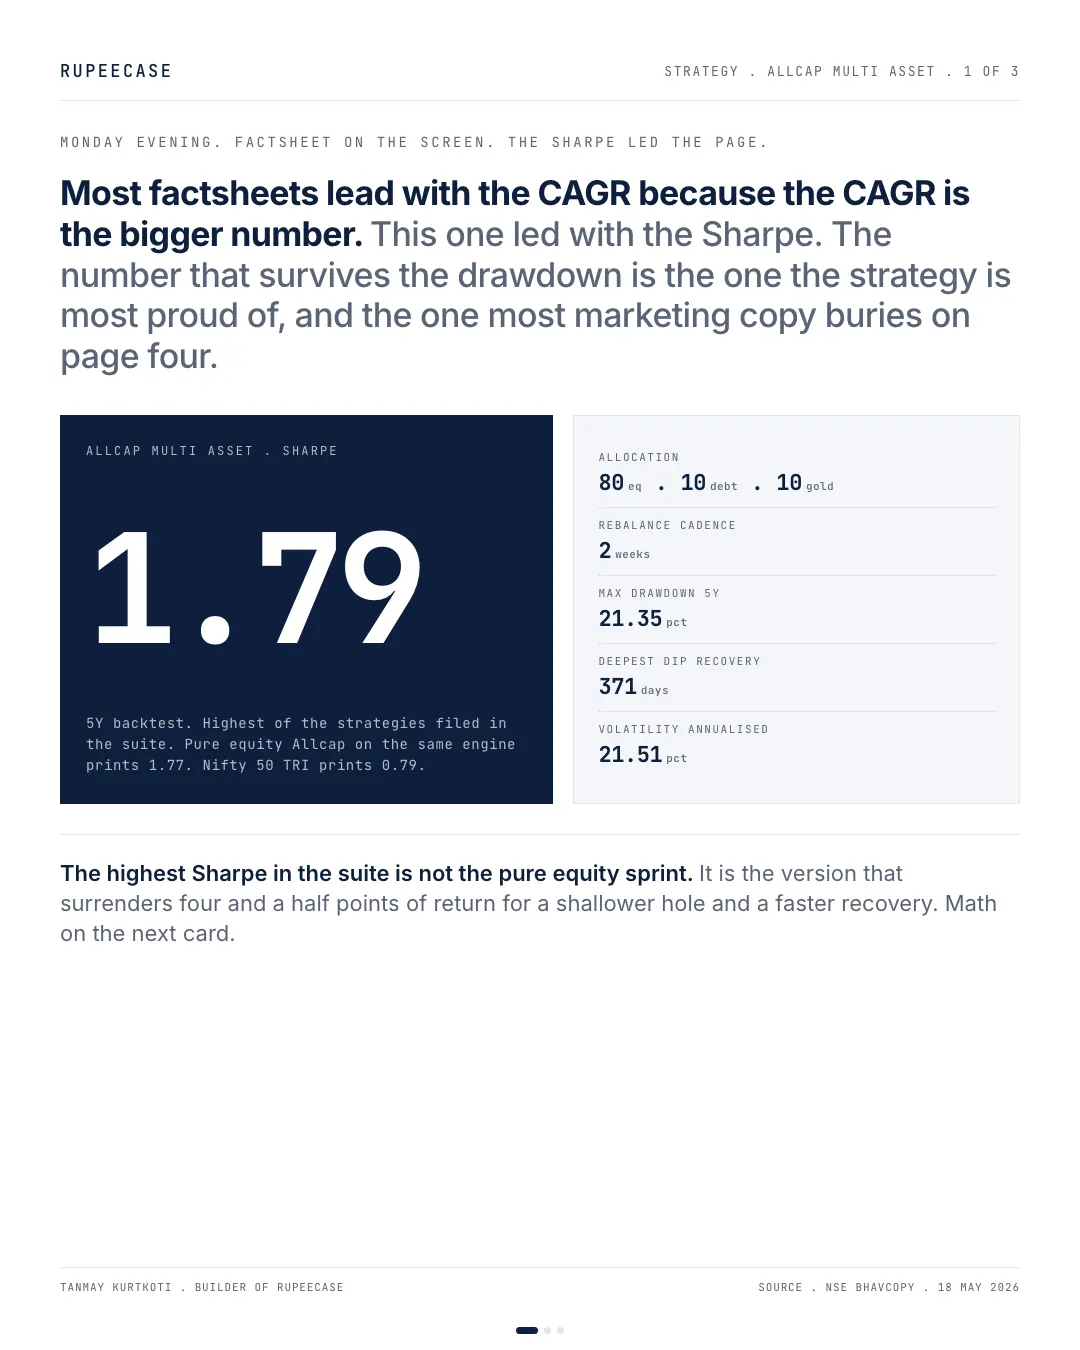
Monday evening, factsheet on the screen. The strategy quoted its Sharpe ratio before its CAGR. That is the giveaway. Most marketing copy quotes the return first because the return is the bigger number. This one led with 1.79.
The better Sharpe of the two is not the pure-equity sprint. It is the mix, which on the 27 Apr 2026 lineup ranks second on the whole shelf, behind only the newer Dynamic Asset Allocator.
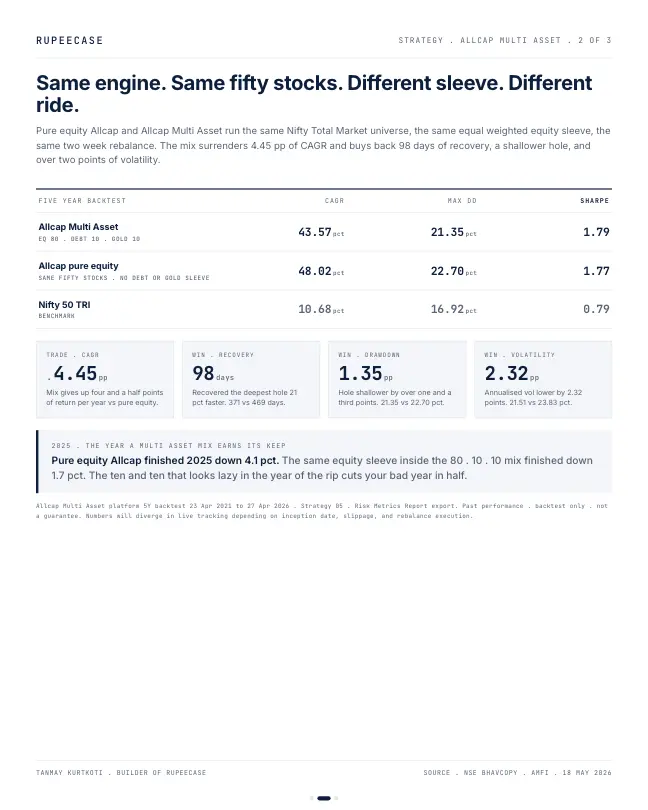
Same backtest engine. Same fifty stocks under five thousand rupees, equal-weight inside the equity sleeve. Same two week rebalance. One version runs a hundred pct equity. The other runs eighty pct equity, ten pct LIQUIDCASE, ten pct GOLDBEES. That is the only difference.
Numbers, five year backtest. Pure-equity Allcap printed 48.02 pct CAGR, max DD 22.70 pct, recovered the deepest hole in 469 days. The 80/10/10 mix printed 43.57 pct CAGR, max DD 21.35 pct, recovered the same dip in 371 days, volatility 21.51 against 23.83 on the pure-equity. Surrendered 4.45 percentage points of return. Bought back 98 days of recovery, a shallower hole, two and a third points of volatility. The Sharpe edged up from 1.77 to 1.79.
2025 is where you tell whether a mix is doing its job. Pure-equity Allcap finished 2025 down 4.1 pct. The 80/10/10 version, same equity sleeve, same names, same rebalance, finished down 1.7 pct. The ten and ten that looks lazy in the year of the rip is the ten and ten that cuts your bad year in half.
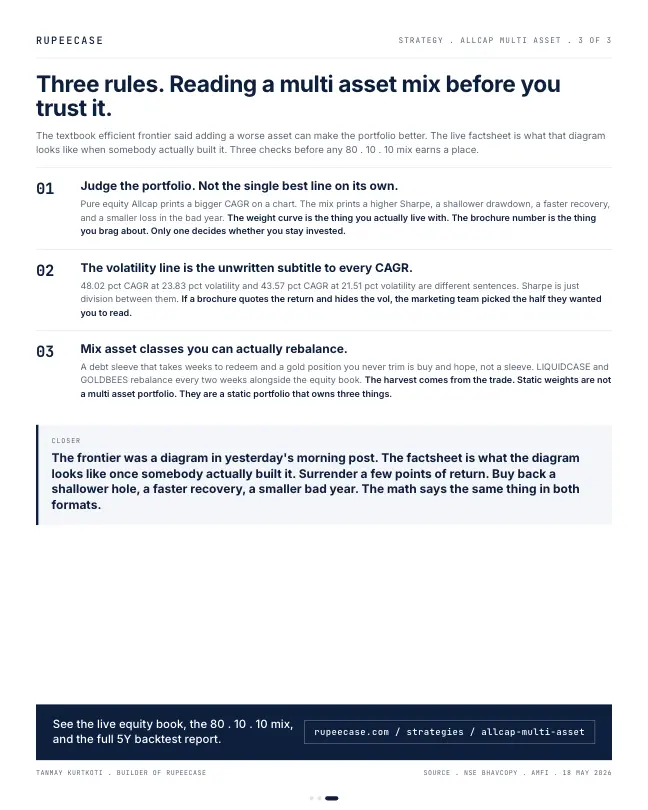
Three rules I keep coming back to. Judge the portfolio by what it does to your weight curve, not what its single best line earns on its own. The volatility number is the unwritten subtitle to every CAGR, and the Sharpe is just division between them. Mix the asset classes you can actually rebalance. Buy and hope is not a sleeve
Three sleeves, three jobs
The mix is easier to understand as three jobs than as three tickers. The equity sleeve is the engine: fifty stocks, rotated every two weeks. The debt sleeve is dry powder: it barely moves, which is the point. The gold sleeve is the one that tends to move on its own clock, often up when equity is under stress.
- Equity, 50 stocks80%
- Debt sleeve10%
- Gold sleeve10%
Target weights from the strategy rules, reset at each two week rebalance. RupeeCase strategy page.
This is the core idea of modern portfolio theory in one picture. What you add to a portfolio matters less for its own return than for how it moves against everything else you hold. The free Learn module on modern portfolio theory builds that from scratch, with the efficient frontier and the limits of the theory on Indian data.
Where the smoother ride comes from
Be honest about the mechanics. Most of the drop in volatility is plain dilution: 20 percent of the money is in things that swing far less than equity. Correlation adds the extra. If the cushion moved in perfect lockstep with equity, you would get only the dilution. Because it does not, the blend is calmer than the weighted average of its parts.
Try it. Equity at 24 percent volatility is close to the model Allcap's own figure (24.10 percent annualised from month end values, Aug 2021 to Apr 2026, Model, back tested, as of 27 Apr 2026). The cushion's 8 percent is an assumption for the example.
Set correlation to 1 and the saving goes to zero. Set it to minus 0.3 and the blend drops below 19 percent. Same weights. Different relationship.
The rebalance is where the cushion earns its keep
A cushion that is never used is just a lower return. The two week rebalance is what turns it into something. Worked example on Rs 10,00,000 split 80/10/10, with assumed moves.
- A bad two months. Equity falls 20 percent: Rs 8,00,000 becomes Rs 6,40,000. Debt gains 1 percent to Rs 1,01,000. Gold gains 5 percent to Rs 1,05,000. Total: Rs 8,46,000, down 15.4 percent against 20 percent for pure equity.
- The rebalance. Equity is now 75.7 percent of the portfolio. Back to 80 percent means Rs 6,76,800 in equity, so the rules sell Rs 16,400 of debt and Rs 20,400 of gold and buy Rs 36,800 of equity, at the low.
- The recovery. Equity gains 25 percent and the cushions stay flat. The equity sleeve becomes Rs 8,46,000, and with Rs 84,600 each in debt and gold the total is Rs 10,15,200.
- Compare. Pure equity is back to Rs 10,00,000. The same mix without the rebalance would be at Rs 10,06,000. The rebalanced mix is ahead of both.
That is the mechanism behind "mix the asset classes you can actually rebalance". The gold and debt did not need high returns. They needed to be there, unhurt, on the day equity was cheap. Each rebalance sale can carry tax, which the example leaves out.
The current lineup, side by side
Three versions of the same equity engine, Model, back tested, as of 27 Apr 2026.
- Allcap, 100% equity1.68
- TotalMarket Hybrid, 80/201.77
- Allcap Multi Asset, 80/10/101.81
Sharpe ratio. Model, back tested, as of 27 Apr 2026. RupeeCase lineup.json.
The CAGRs run the other way: 44.70 percent for Allcap, 39.53 percent for TotalMarket Hybrid, 40.47 percent for Allcap Multi Asset. Max drawdowns are minus 22.72, minus 21.82 and minus 21.32 percent. On the month end model values, 2025 finished at minus 4.2 percent for Allcap, minus 3.7 percent for the 80/20 version with debt only, and minus 1.7 percent for the version with gold. Gold did most of the cushioning that year, which is the story in the gold free twin note.
MythAdding a lower return asset can only make a portfolio worse.
FactIt lowers the return, but if it moves differently from equity it can lower risk by more. Here the mix gave up CAGR and still posted the higher Sharpe.
The asset allocation calculator runs your own split, and the Sharpe ratio explainer shows the division behind the 1.81.
Questions readers ask
Why does a multi asset portfolio have a higher Sharpe ratio than pure equity?
Sharpe is return above the risk free rate divided by volatility. A debt and gold sleeve lowers the return a little but can lower volatility by more, because those assets do not move in step with equity. On the RupeeCase lineup, Allcap Multi Asset shows 1.81 against 1.68 for pure equity Allcap (Model, back tested, as of 27 Apr 2026).
Does adding gold to an equity portfolio reduce drawdowns?
It can, when gold moves differently from equity during the fall. In 2025 the 80/10/10 model with gold finished at minus 1.7 percent, the 80/20 version with debt only at minus 3.7 percent, and pure equity at minus 4.2 percent on month end values (Model, back tested, as of 27 Apr 2026). It is not guaranteed in every fall.
How does correlation affect portfolio volatility?
The lower the correlation between two holdings, the more their swings cancel and the lower the blend's volatility. With 80 percent equity at 24 percent volatility and 20 percent in an 8 percent volatility cushion, the blend is about 19.3 percent at zero correlation and 20.8 percent if they move in lockstep.
The cards
3 cards. Swipe, or tap to open.
Explore next
Learn it properly, then see it applied.
- Free module 3.1The Momentum Factor11 min read
- StrategyAllcap strategyNifty Total Market, 50 stocks, every 2 weeks
- Free module 4.1Modern Portfolio Theory, What Actually Matters11 min read
- CalculatorAsset allocation by risk profileFree, with the formula and a worked example
- StrategyAllcap Multi Asset strategyNifty Total Market, 52 stocks, every 2 weeks
- Blog topicStrategy notes notes22 notes
Related
- Large Mid Multi Asset: the card that finished 2025 greenIt closed 2025 up 10.1 percent while the broad cards fell, giving up 6.45 points of CAGR for a 17.61 percent worst hole and the highest win rate.Strategy notes . . 5 min
- TotalMarket Hybrid: the gold free twinSwapping the 10 percent gold sleeve for debt gave back just under a point of CAGR, 43.57 against 42.62, half a point of drawdown and 35 days of recovery.Strategy notes . . 6 min
- Sharpe ratio, decoded on a live cardAllcap Multi Asset earned 4.1 times the Nifty's CAGR for 1.5 times its volatility, which is what a Sharpe of 1.79 against 0.79 means in plain numbers.Strategy notes . . 5 min
Educational content only. Figures are illustrative and computed on historical or representative data for teaching purposes, not investment advice. Past performance does not guarantee future returns. Sourced from NSE, BSE, SEBI, AMFI and RBI public data.