

Strategy notes..6 min read
Large Cap Multi Asset: boring is the product
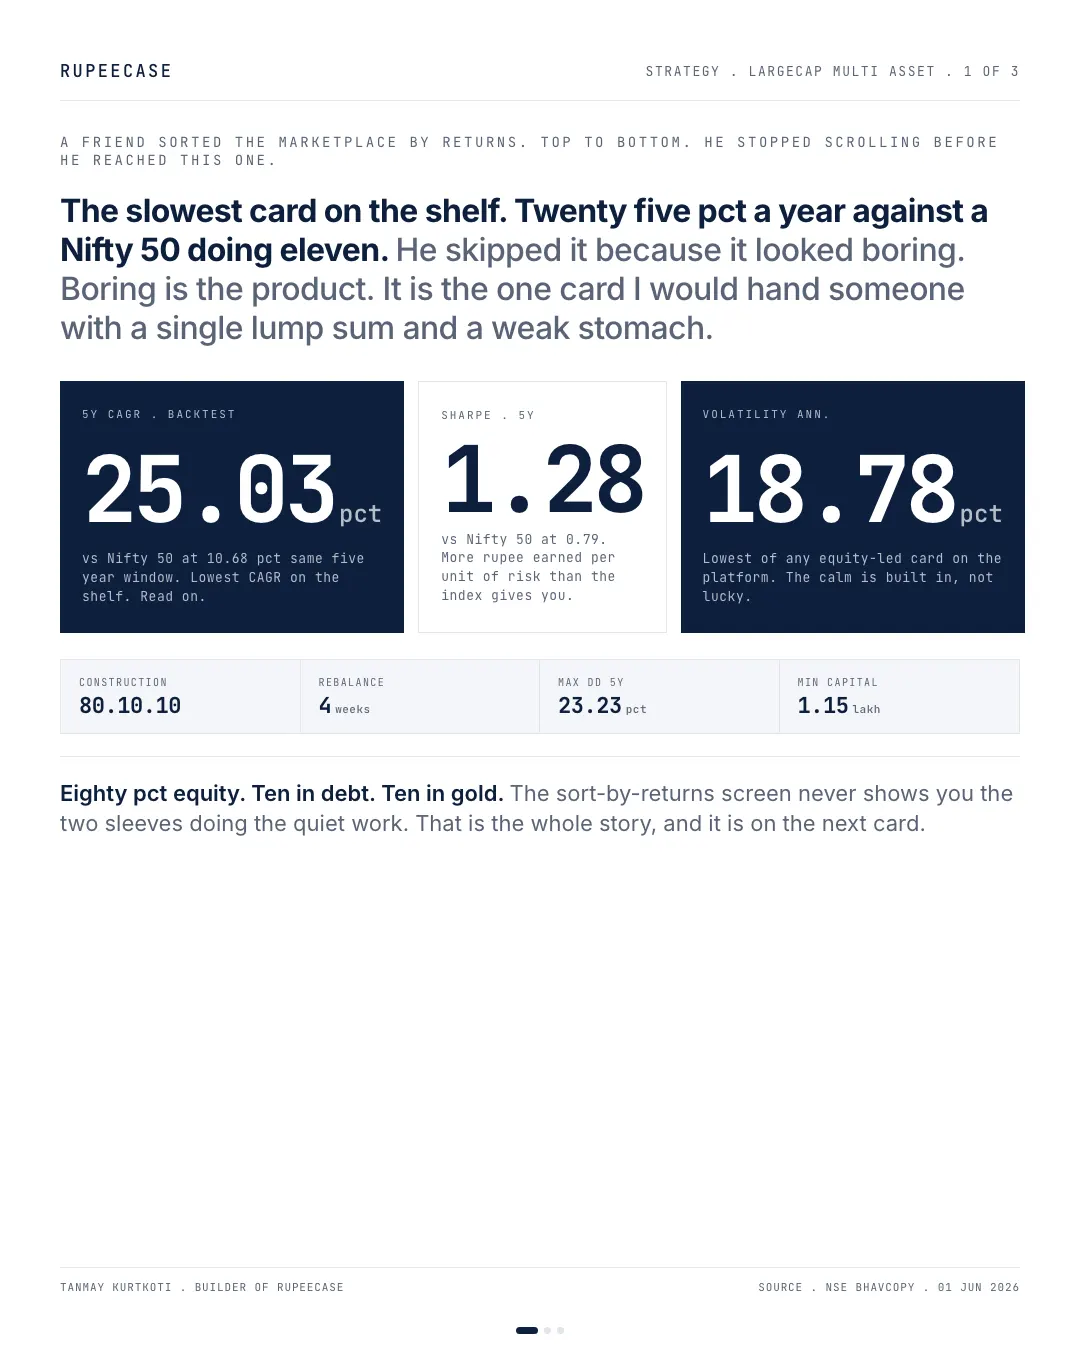
The slowest card on the shelf printed 25.03 percent CAGR at the lowest equity led volatility and cut the 2025 loss of its pure equity twin roughly in half.
Model, back tested, as of 27 Apr 2026, as published then; the strategy page shows the current figure.
By Tanmay Kurtkoti, founder of QC Alpha and builder of RupeeCase
A friend sorted the RupeeCase marketplace by returns last week and stopped scrolling about a third of the way down.
He landed on the 40-something percent cards. The smallcap and midcap names. The ones that look like a decision. He never reached the bottom of the list, where the slowest card sits at 25 percent. I asked him why he skipped it. He said it looked boring.
Boring is the product.
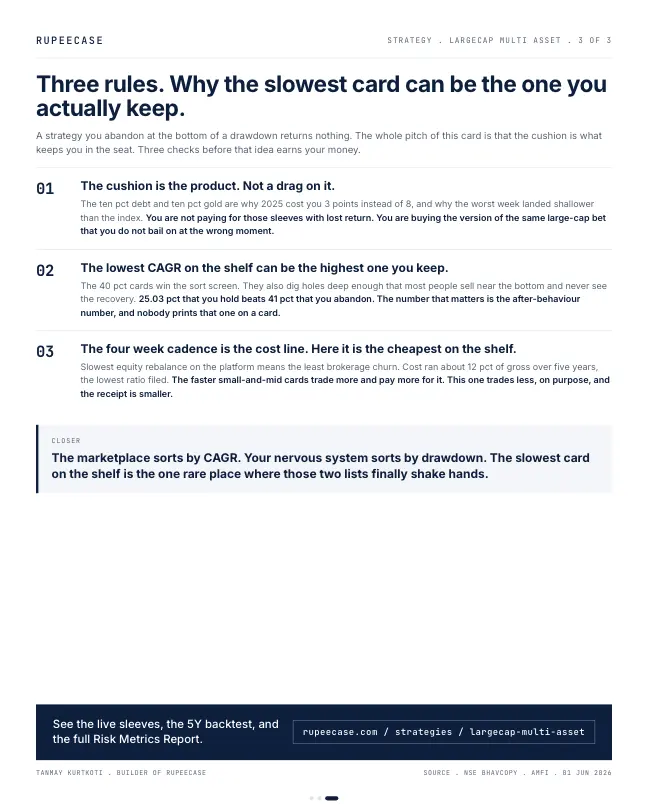
That card is the LargeCap Multi Asset strategy. Eighty percent across twenty large-cap names, equal weight. Ten percent in a liquid debt sleeve. Ten percent in gold. It rebalances every four weeks, the slowest equity cadence on the platform, which also makes it the cheapest to run. Cost ran about 12 percent of gross over five years. The faster small-and-mid cards trade more and pay for it.
The five year backtest reads 25.03 percent a year against the Nifty 50 at 10.68. Sharpe 1.28 versus 0.79. Volatility 18.78 percent, the lowest of any equity-led card on the shelf. Its worst single week was actually shallower than the index had. None of that fits on a sort-by-returns screen.
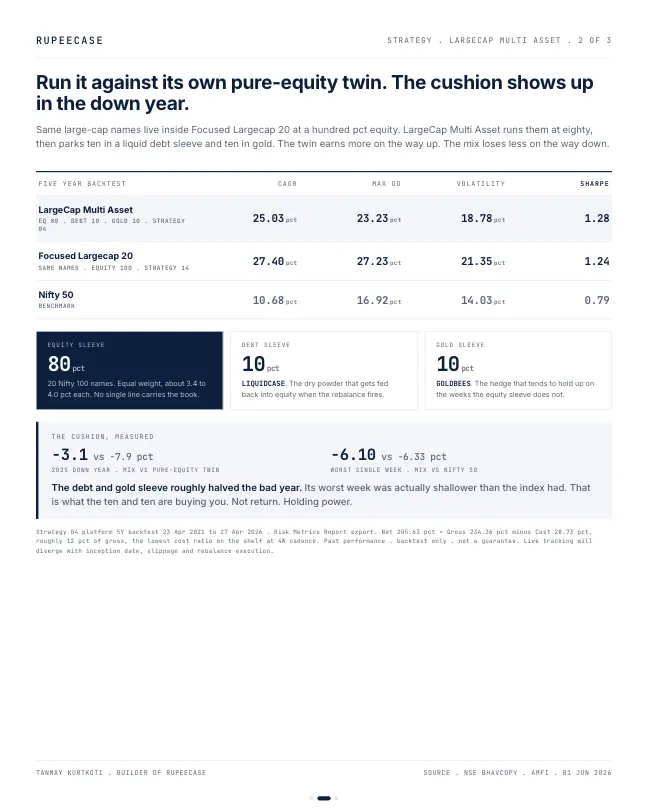
Here is the number that matters. Run it against its own pure-equity twin, the same large-cap names at a hundred percent equity. The twin earns about two and a third more points of CAGR a year. It also fell 7.9 percent in 2025. The multi-asset version, with the debt and gold cushion, lost 3.1. The sleeve cut the bad year roughly in half.
The marketplace sorts by CAGR. Your nervous system sorts by drawdown. The slowest card on the shelf is the one where those two lists finally agree.
Past performance is backtest data, not a promise.
Three siblings on the same twenty names
The large cap shelf now has three versions of the same idea, and the lineup figures to 27 April 2026 make the trade very plain. Focused Largecap 20 is pure equity. Largecap Hybrid puts 20 percent in a liquid debt sleeve. Large Cap Multi Asset splits that 20 percent into 10 debt and 10 gold.
Model, back tested, as of 27 Apr 2026: the pure equity card shows 26.29 percent CAGR, the multi asset card 24.36, the hybrid 22.74. So the cushion still costs just under two points a year against pure equity. Now look at the other side of the ledger.
- Focused Largecap 20-23.56%
- Largecap Hybrid-22.04%
- Large Cap Multi Asset-20.96%
Maximum drawdown. Model, back tested, as of 27 Apr 2026. RupeeCase lineup.json.
The multi asset card fell least, and its Sharpe ratio is the highest of the three: 1.32, against 1.20 for pure equity and 1.25 for the debt only hybrid (same source and date). It gave up return and got back more than it gave up, measured per unit of risk. Notice it also beat its debt only sibling on return and on drawdown. That is the part worth understanding, because it is not luck. It is arithmetic.
Why two cushions beat one
Portfolio theory has one result that still surprises people the first time they see it. The risk of a mix is not the average of the risks of its parts. It is smaller, by an amount that depends on how closely the parts move together. That closeness is the correlation, a number between minus 1 and plus 1.
I pulled twelve months of NSE data to 30 Sep 2026 to put real numbers in. The Nifty 50 ran at about 16.9 percent annualised volatility, measured on monthly returns. An NSE listed gold ETF ran at about 26.6 percent, more volatile than the index. Their monthly correlation was about 0.20. A liquid debt sleeve barely moves at all, so treat its volatility as close to zero.
If you averaged the risks, an 80 percent equity, 10 percent gold, 10 percent debt book would sit near 16.2 percent. The formula says about 14.3. Gold added risk on its own and still lowered the risk of the whole, because it zigged on different days. Change the correlation in the calculator to 1 and the benefit vanishes. Set it to 0 and it grows.
What a four week rebalance does on Rs 10,00,000
The second half of the story is the slow cadence. Every four weeks the strategy puts the weights back to 80, 10 and 10. That sounds like housekeeping. It is also where the cushion does its work.
Say you start with Rs 10,00,000: Rs 8,00,000 in the twenty stocks, Rs 1,00,000 in gold, Rs 1,00,000 in debt. In the next four weeks the stocks rise 10 percent, gold is flat and debt earns about 0.45 percent. The book is now Rs 10,80,450, with equity at Rs 8,80,000, which is 81.4 percent.
- DriftEquity Rs 8,80,000, gold Rs 1,00,000, debt Rs 1,00,450. Total Rs 10,80,450.
- Targets80 percent is Rs 8,64,360. Each 10 percent sleeve is Rs 1,08,045.
- TrimSell Rs 15,640 of stocks, the part of the rally above target.
- Top upRs 8,045 goes to gold and Rs 7,595 to debt. Weights are back to 80, 10, 10.
Run the same steps after a bad month and they flip. The stocks are below 80 percent, so the rebalance sells some gold and debt and buys stocks after they have fallen. Nobody has to feel brave. The rule does the selling high and buying low, every four weeks, whatever the headlines say.
Doing it every four weeks rather than every two also halves the number of times the book trades. Fewer trades, a smaller cost bill. That is the cheapest cadence on the shelf, and it is part of why the boring card keeps more of what it earns.
The free Learn module on modern portfolio theory works through correlation and the efficient frontier with a quiz and a certificate. The Large Mid Multi Asset post runs the same comparison one step down the market cap curve.
Questions readers ask
Why does adding gold reduce portfolio risk if gold is volatile?
Because portfolio risk depends on how the parts move together, not only on how much each one moves. Over the twelve months to 30 Sep 2026 an NSE listed gold ETF was more volatile than the Nifty 50, about 26.6 percent against 16.9, but the correlation of their monthly returns was only about 0.20. An 80 percent equity, 10 percent gold, 10 percent debt mix of those two works out near 14.3 percent volatility, below the index on its own.
Is a multi asset portfolio worse than pure equity because it returns less?
It returns less in a strong market and loses less in a weak one. On the RupeeCase large cap shelf, the multi asset version shows about two points less CAGR than pure equity, but a shallower worst fall and a higher Sharpe ratio, 1.32 against 1.20 (Model, back tested, as of 27 Apr 2026). Which one suits a reader depends on the fall they can sit through.
How often should an 80 20 portfolio be rebalanced?
There is no single right answer. Rebalancing more often keeps the weights tighter but trades more and costs more; rebalancing less often lets the weights drift further. The large cap multi asset card resets every four weeks, the slowest equity cadence on the RupeeCase shelf.
The cards
3 cards. Swipe, or tap to open.
Explore next
Learn it properly, then see it applied.
- Free module 3.1The Momentum Factor11 min read
- StrategyFocused Largecap 20 strategyNifty 100, 20 stocks, every 4 weeks
- Free module 4.1Modern Portfolio Theory, What Actually Matters11 min read
- CalculatorAsset allocation by risk profileFree, with the formula and a worked example
- StrategyLarge Cap Multi Asset strategyNifty 100, 22 stocks, every 4 weeks
- Blog topicStrategy notes notes22 notes
Related
- Large Mid Multi Asset: the card that finished 2025 greenIt closed 2025 up 10.1 percent while the broad cards fell, giving up 6.45 points of CAGR for a 17.61 percent worst hole and the highest win rate.Strategy notes . . 5 min
- Allcap Multi Asset: the better Sharpe is the mixThe 80/10/10 version of Allcap gave up 4.45 points of CAGR for a shallower hole, 98 fewer days underwater and a 2025 loss cut from 4.1 to 1.7 percent.Strategy notes . . 5 min
- Large Mid Hybrid: the debt sleeve that did two jobsThe 20 percent liquid sleeve softened the worst fall to 18.30 percent and, because it is never traded fortnightly, cut the five year friction bill from 67 to 54 points.Strategy notes . . 6 min
Educational content only. Figures are illustrative and computed on historical or representative data for teaching purposes, not investment advice. Past performance does not guarantee future returns. Sourced from NSE, BSE, SEBI, AMFI and RBI public data.