

Strategy notes..5 min read
Sharpe ratio, decoded on a live card
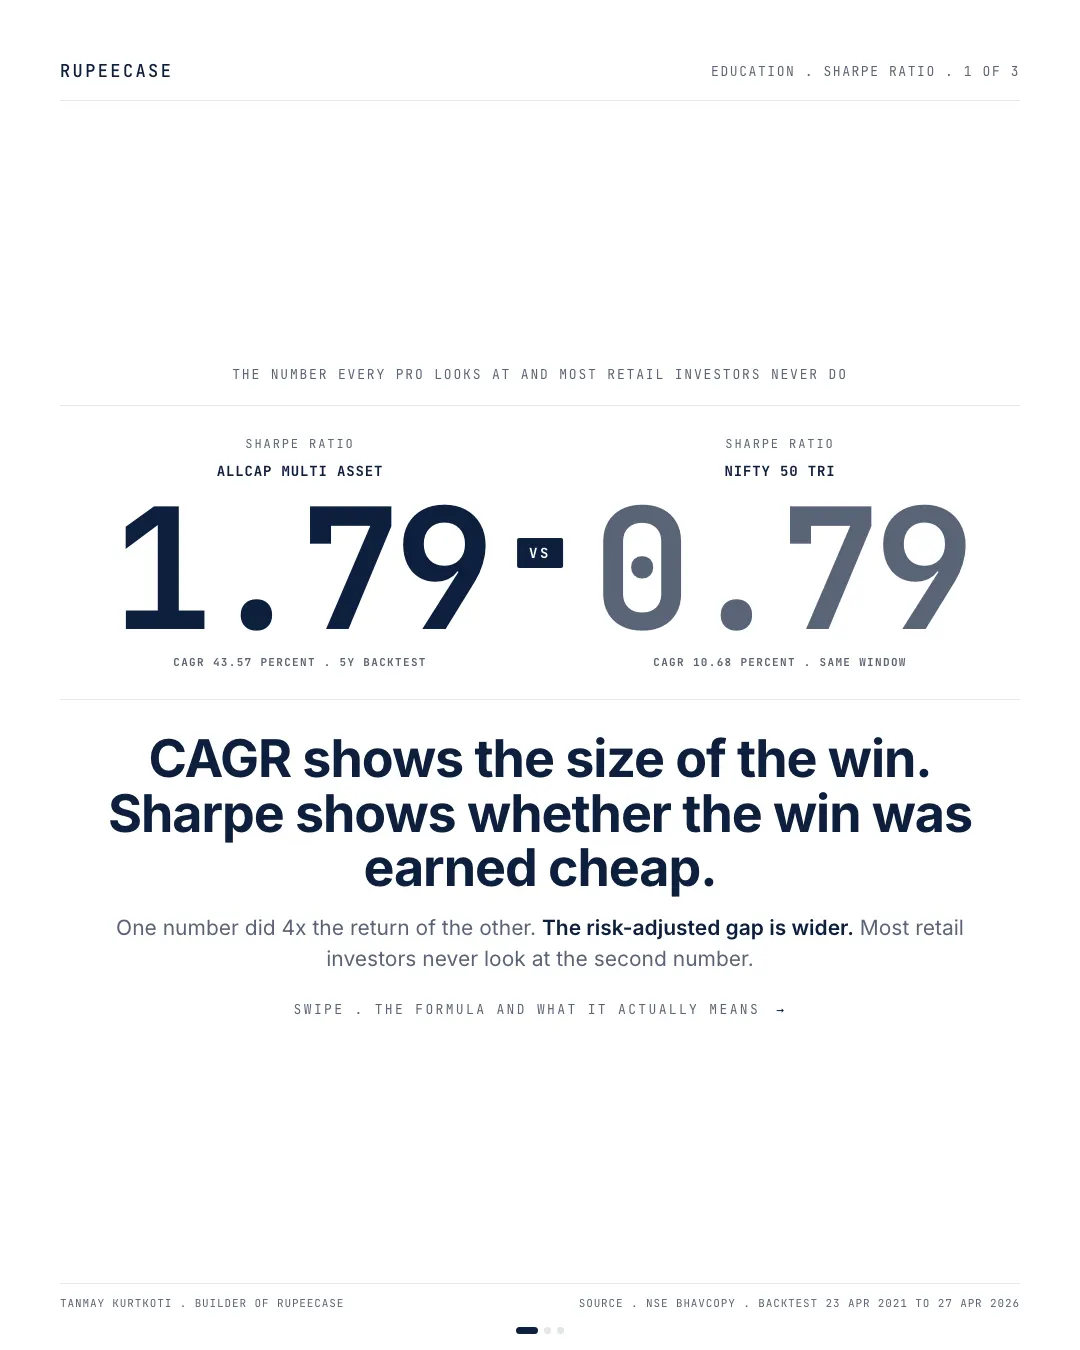
Allcap Multi Asset earned 4.1 times the Nifty's CAGR for 1.5 times its volatility, which is what a Sharpe of 1.79 against 0.79 means in plain numbers.
Model, back tested, as of 27 Apr 2026, as published then; the strategy page shows the current figure.
By Tanmay Kurtkoti, founder of QC Alpha and builder of RupeeCase
Pulled the Sharpe numbers across the marketplace last week. Wanted to know which strategy earned its return cleanly and which one earned it by sitting through drawdowns most retail investors would never have held through.
CAGR never tells you that. CAGR shows the size of the win. It does not show the volatility you ate to earn it. The plain-English explainer on volatility, drawdown and Sharpe sits at rupeecase.com/learn/
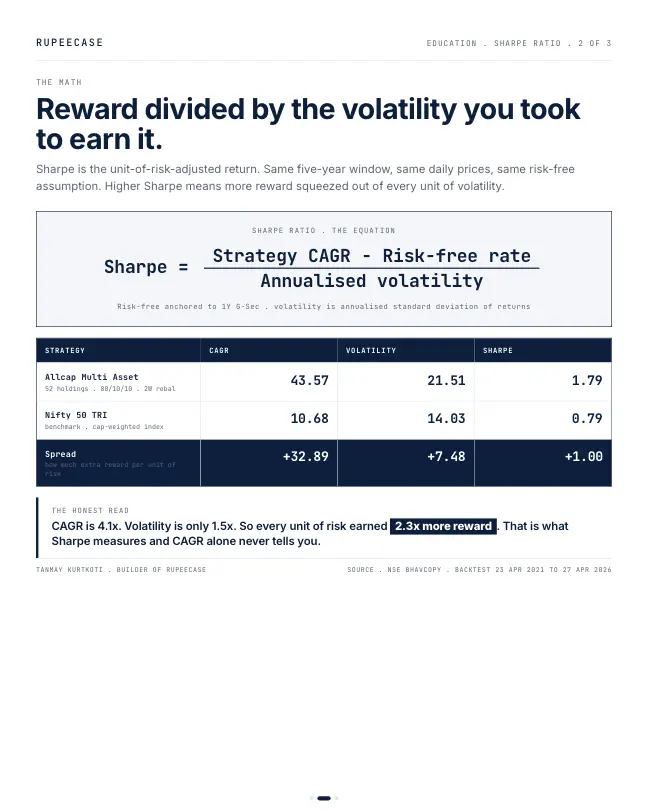
The math. Allcap Multi Asset did 43.57 percent CAGR over the five-year backtest with 21.51 percent annualised volatility. Nifty 50 TRI did 10.68 with 14.03 over the same window. The CAGR is 4.1x bigger. The volatility is only 1.5x bigger. So the reward per unit of risk is 2.3x. That is the Sharpe ratio . 1.79 versus 0.79. The methodology behind the 80/10/10 equity-debt-gold sleeve that produced it is open at rupeecase.com/strategies/methodology
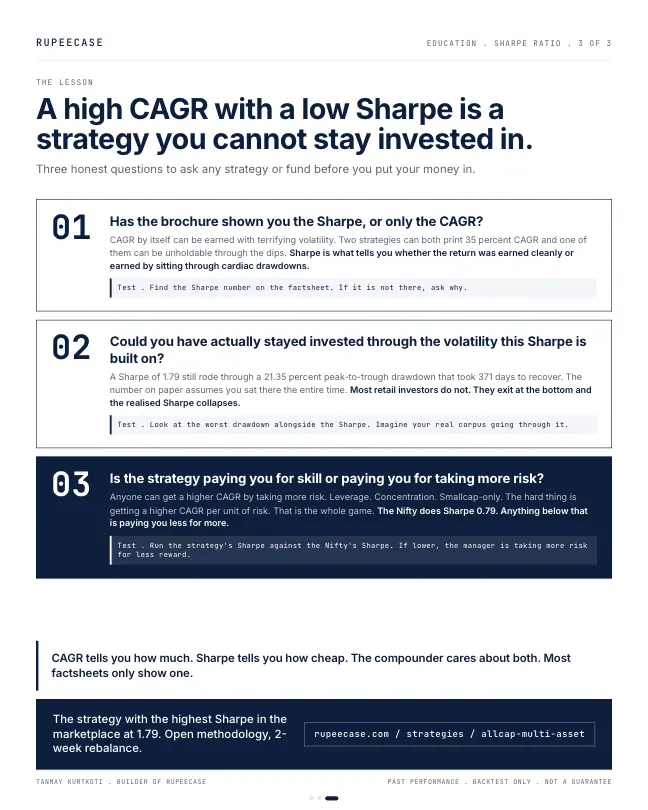
A high CAGR with a low Sharpe is a strategy you cannot stay invested in. Which is the part nobody puts on the brochure.
Three questions worth running on any strategy or fund before money goes in.
One. Has the factsheet shown you the Sharpe or only the CAGR? Two strategies can both print 35 percent. Only one of them is holdable through the dips. Sharpe tells you which is which.
Two. Could you have actually sat through the worst drawdown that built the Sharpe? The 1.79 assumes a real human stayed invested through a 21.35 percent peak-to-trough that took 371 days to recover. The behavioural-fit test that tells you whether you can hold through that sits at rupeecase.com/risk-profile
Three. Is the manager paying you for skill or paying you for taking more risk? Nifty does Sharpe 0.79. Anything below that is paying you less reward for more risk eaten. The fee-stack version of the same argument is at rupeecase.com/compare
The strategy itself, with the full risk-adjusted breakdown, sits at rupeecase.com/strategies/allcap-multi-asset
CAGR tells you how much. Sharpe tells you how cheap. The compounder cares about both.
The same card on today's factsheet
The opening uses the figures published on 4 May. The current Allcap Multi Asset factsheet reads: 40.47 percent CAGR, 21.41 percent annualised volatility, Sharpe ratio 1.81, maximum drawdown 21.32 percent. The Nifty 50 column on the same page reads 9.80 percent, 14.04 percent, Sharpe 0.73 and a 16.92 percent drawdown (Model, back tested, as of 27 Apr 2026). The ratio of the two Sharpe figures, about 2.5 to 1, is close to what the opening found.
Sharpe, by hand
The Sharpe ratio is the return above a risk free rate, divided by volatility. Volatility is how much the returns swing around their average, scaled to a year. The ratio answers one question: how much extra return did each unit of swing pay?
Here is a worked example with two strategies that both show 35 percent a year. Say the risk free rate is 6 percent; that is an assumption for the example. Strategy A swings 20 percent a year. Strategy B swings 30.
- A: (35 minus 6) divided by 20 = 1.45.
- B: (35 minus 6) divided by 30 = 0.97.
Same CAGR row, very different ride. That is the opening's point about two cards both printing 35 percent.
One caution. Factsheets compute the ratio from weekly or daily returns over the whole window, not from the headline CAGR. So if you plug the headline numbers into the calculator, you will land near the published figure but not on it. Use the shortcut to compare, and the published number to quote.
Three ratios, three kinds of pain
Sharpe treats an upside swing and a downside swing the same. That is its main weakness, and it is why factsheets carry two cousins next to it.
- SharpeExcess return per unit of all volatility, up and down.
- SortinoExcess return per unit of downside volatility only.
- CalmarReturn per unit of the worst peak to trough fall.
On the Allcap Multi Asset factsheet the three read 1.81, 1.71 and 2.06; for the Nifty 50 column, 0.73, 0.70 and 0.58 (Model, back tested, as of 27 Apr 2026). The strategy's Sortino sits a little below its Sharpe, which says its downside swings are a touch larger than its upside swings in this window. The Calmar is the one I look at hardest, because drawdown is the number that decides whether a real person stays invested.
Sharpe across the shelf
- Allcap Multi Asset1.81
- Large Mid Multi Asset1.72
- Allcap1.68
- Focused Alpha 51.60
- Nifty 50, factsheet column0.73
Sharpe ratios. Model, back tested, RupeeCase lineup.json and factsheets, as of 27 Apr 2026.
Focused Alpha 5 has the highest CAGR on the shelf, 54.08 percent, and sits fourth on this list (Model, back tested, as of 27 Apr 2026). It paid more, and made you swing more for it. Allcap Multi Asset paid less, and swung less per rupee of return. The 10 percent debt and 10 percent gold sleeves are part of why: they move differently from the stocks, so the whole book swings less than the equity part alone.
MythA high Sharpe ratio means the strategy does not have big losses.
FactAllcap Multi Asset, with a Sharpe of 1.81, still fell 21.32 percent at its worst. Sharpe measures return per swing, not the depth of a fall.
The free Learn module on performance measurement covers Sharpe, Sortino, Calmar, alpha and attribution with Indian examples and a quiz, and the Sharpe and volatility calculator works them out from your own return series. Related: drawdown is the KPI nobody asks about and 5 against 20 against 50 stocks.
Questions readers ask
What is a good Sharpe ratio?
It depends on the comparison. The useful test is against the index on the same dates and the same method: on the Allcap Multi Asset factsheet the strategy shows 1.81 against 0.73 for the Nifty 50 column (Model, back tested, as of 27 Apr 2026). A ratio well below the index's means you were paid less per unit of swing than by simply holding the market.
What is the difference between Sharpe and Sortino ratio?
Both divide excess return by a measure of risk. Sharpe uses all volatility, upside and downside. Sortino uses only downside volatility, so it does not penalise a strategy for large up moves.
Can I calculate the Sharpe ratio from CAGR and volatility?
As a shortcut, yes: subtract a risk free rate from the CAGR and divide by annualised volatility. Published figures are usually computed from weekly or daily returns, so the shortcut lands near the published number, not on it.
The cards
3 cards. Swipe, or tap to open.
Explore next
Learn it properly, then see it applied.
- Free module 3.1The Momentum Factor11 min read
- CalculatorLumpsum calculatorFree, with the formula and a worked example
- Free module 4.4Performance Measurement9 min read
- CalculatorSharpe and volatilityFree, with the formula and a worked example
- StrategyAllcap Multi Asset strategyNifty Total Market, 52 stocks, every 2 weeks
- Blog topicStrategy notes notes22 notes
Related
- Allcap Multi Asset: the better Sharpe is the mixThe 80/10/10 version of Allcap gave up 4.45 points of CAGR for a shallower hole, 98 fewer days underwater and a 2025 loss cut from 4.1 to 1.7 percent.Strategy notes . . 5 min
- Smallcap: the honest yearThe RupeeCase Smallcap backtest shows four easy years and one awful one, and the 41 percent CAGR only belongs to the investor who held through 2025.Strategy notes . . 6 min
- The cadence question: why two weeksRupeeCase Large Midcap rebalanced 131 times in five years at a 14 day average gap, a cadence chosen to stop a momentum signal rotting without paying quarterly latency.Strategy notes . . 5 min
Educational content only. Figures are illustrative and computed on historical or representative data for teaching purposes, not investment advice. Past performance does not guarantee future returns. Sourced from NSE, BSE, SEBI, AMFI and RBI public data.