

Strategy notes..5 min read
Large Midcap: when the return is a tie, the drawdown decides
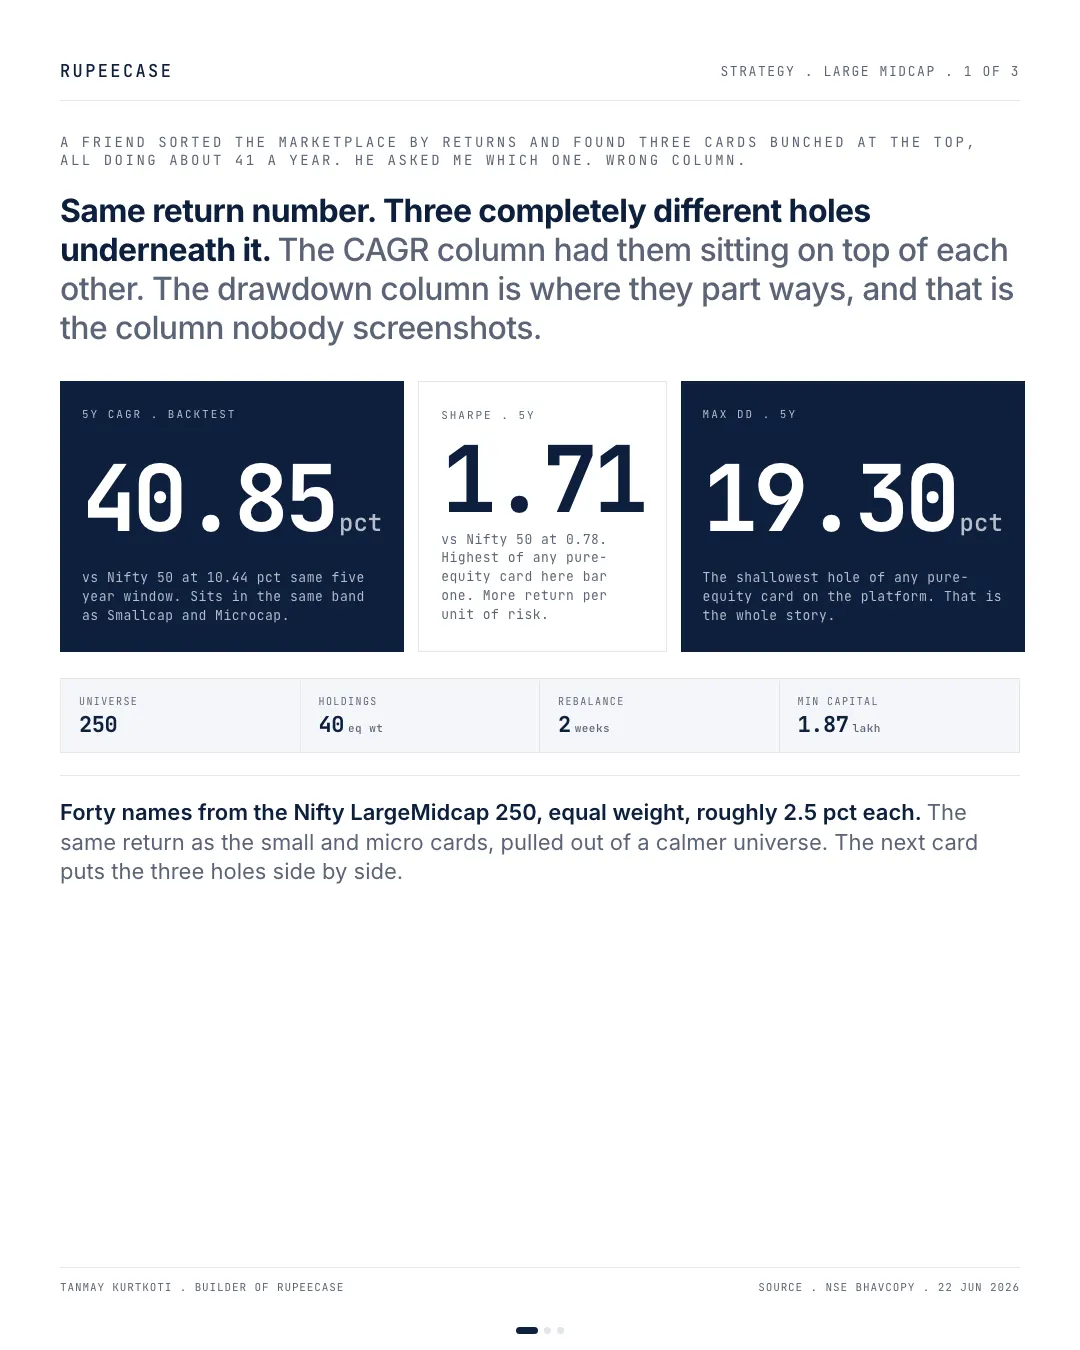
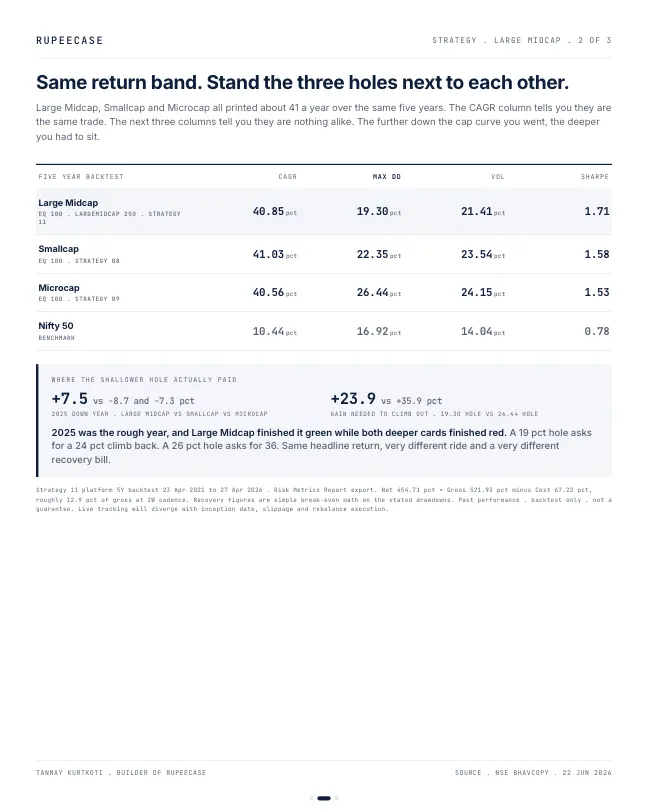
Large Midcap, Smallcap and Microcap all printed about 41 percent, with holes of 19.30, 22.35 and 26.44 percent, and only the first finished 2025 up.
Model, back tested, as of 27 Apr 2026, as published then; the strategy page shows the current figure.
By Tanmay Kurtkoti, founder of QC Alpha and builder of RupeeCase
A friend sorted the RupeeCase marketplace by returns last week. He stopped scrolling right at the top, where three cards sat almost on top of each other, all printing about 41 percent a year over five years. He asked me which of the three to pick.
He was reading the wrong column.
Large Midcap did 40.85. Smallcap did 41.03. Microcap did 40.56. For any practical purpose, a tie. And once the return is a tie, the CAGR column has nothing left to tell you. So I pointed him one column over.
Max drawdown. Large Midcap dug a 19.30 percent hole. Smallcap went to 22.35. Microcap fell 26.44. Same return, three very different rides. The further down the cap curve you reached for that 41, the deeper you had to sit to collect it.
Here is where it stopped being academic. 2025 was the rough year. Large Midcap finished it up 7.5 percent. Both of the deeper cards finished red, down 8 and 7. And the recovery math is unforgiving. A 19 percent hole needs a 24 percent climb just to break even. A 26 percent hole needs 36. Most people sell somewhere in the middle of that climb and never see the rest of it.
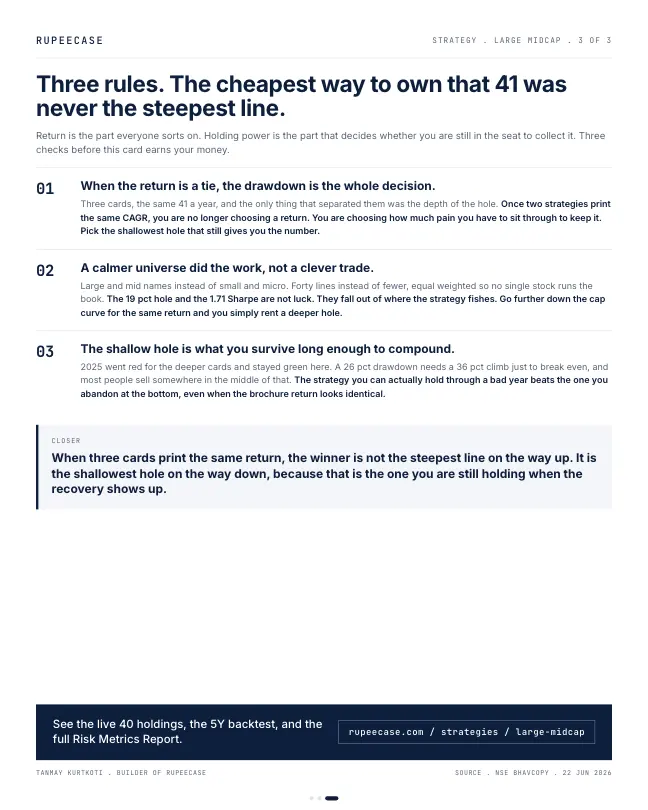
None of this is a clever trade. It falls out of where the strategy fishes. Large and mid names instead of small and micro, forty lines equal weighted so no single stock runs the book. The calmer hole and the higher Sharpe come from the universe, not from luck.
The line I keep coming back to: when the return is a tie, the drawdown is the entire decision. The strategy you can hold through a bad year beats the one you abandon at the bottom, even when the brochure number looks identical.
Still a tie on today's file
The opening uses the figures published on 22 June. On the current lineup file the three cards have all moved, and they are still tied. Large Midcap: 37.83 percent CAGR. Smallcap: 37.40. Microcap: 37.33 (Model, back tested, as of 27 Apr 2026). Half a point separates first from third. The column next door separates them far more.
- Large Midcap-19.31%
- Smallcap-22.34%
- Microcap-26.43%
Maximum drawdown. Model, back tested, as of 27 Apr 2026. RupeeCase lineup.json.
The Sharpe ratios line up in the same order: 1.69, 1.59 and 1.52 (same source). With the return tied, every unit of extra swing further down the cap curve was paid for and not rewarded.
The climb back, card by card
A fall needs a larger rise to recover, and the gap grows with depth. That is why a few points of drawdown matter more than they look.
rise needed after Large Midcap's worst fall
From -19.31%. Model, back tested, as of 27 Apr 2026
after Smallcap's
From -22.34%. Model, back tested, as of 27 Apr 2026
after Microcap's
From -26.43%. Model, back tested, as of 27 Apr 2026
The monthly model values show what that meant in the 2025 correction. Large Midcap's month end peak came at the end of Aug 2024. By the end of Apr 2026 it was about 12 percent above that peak. Smallcap's peak came at the end of Dec 2024 and Microcap's at the end of Nov 2024; at the end of Apr 2026 they were still about 6.5 and 3.5 percent below them (Model, back tested nav files). Three cards with the same five year CAGR, and in Apr 2026 only one of them had put the correction fully behind it.
From Jun 2024 to Apr 2026 all three model cards fell into Feb 2025; Large Midcap fell least and was the only one above its old high by Apr 2026.
Put your own amount in
On Rs 10 lakh, the difference between the first and third card's worst fall is Rs 71,200, on strategies that ended up earning almost the same. The opening's line, that when the return is a tie the drawdown is the whole decision, is this arithmetic.
Why the universe sets the hole
- Large Midcap40 names from the Nifty LargeMidCap 250: larger, more traded companies.
- Smallcap50 names from the Nifty Smallcap 250.
- Microcap50 names from the Nifty Microcap 250, the smallest listed band.
The rule is the same momentum engine on a two week rotation in all three. What changes is where it fishes. Smaller companies fall harder and more together when investors turn cautious, so the deeper the universe, the deeper the shared hole. In good years the same exposure can pay, which is why the CAGR row ended level. Over this window, the extra risk earned nothing extra, and the calendar showed it: in 2025 Large Midcap finished up 7.5 percent while Smallcap and Microcap finished down 8.7 and 7.3 (Model, back tested, factsheets of 13 May 2026).
The free Learn module on risk metrics that matter explains drawdown, volatility and the Sharpe ratio with a quiz, and the drawdown recovery calculator works out the climb back from any fall. Related: the cadence question and Smallcap, the honest year.
Questions readers ask
If two strategies have the same CAGR, how do I compare them?
Look at the risk taken to earn it: maximum drawdown, volatility and the Sharpe ratio. On RupeeCase's model cards, Large Midcap, Smallcap and Microcap all show about 37 to 38 percent CAGR, but their worst falls are 19.31, 22.34 and 26.43 percent (Model, back tested, as of 27 Apr 2026).
How much does a portfolio need to gain to recover a 26 percent fall?
About 35.9 percent. The rise needed is 1 divided by (1 minus the fall), minus 1. A 19.31 percent fall needs 23.9 percent and a 22.34 percent fall needs 28.8 percent.
Why do small cap strategies fall more than large and mid cap ones?
Smaller companies are usually less traded and more sensitive to investors turning cautious, so they fall harder and more together in a sell off. A strategy drawing from a smaller universe carries more of that shared risk, whatever its stock picking rule.
The cards
3 cards. Swipe, or tap to open.
Explore next
Learn it properly, then see it applied.
- GuideNifty Next 50 vs Nifty 50: the companies just below the top, and their recordThe 50 companies just below the top: thirteen years of returns, falls and valuations.
- Free module 3.1The Momentum Factor11 min read
- StrategySmallcap strategyNifty Smallcap 250, 50 stocks, every 2 weeks
- CalculatorCAGR calculatorFree, with the formula and a worked example
Related
- The cadence question: why two weeksRupeeCase Large Midcap rebalanced 131 times in five years at a 14 day average gap, a cadence chosen to stop a momentum signal rotting without paying quarterly latency.Strategy notes . . 5 min
- Allcap: the number everyone quotes and nobody picksAllcap carried the highest Sharpe of the three momentum cards at 1.77, with the shallowest drawdown of the three, and still spent 469 days underwater.Strategy notes . . 5 min
- Focused Largecap 20: twenty sized bets on a factsheetTwenty equal weight Nifty 100 names on a four week cadence printed 27.40 percent CAGR with a 27.23 percent drawdown, and the multi asset twin nearly matched its Sharpe.Strategy notes . . 5 min
Educational content only. Figures are illustrative and computed on historical or representative data for teaching purposes, not investment advice. Past performance does not guarantee future returns. Sourced from NSE, BSE, SEBI, AMFI and RBI public data.