

Factors..6 min read
Alpha is beta in disguise
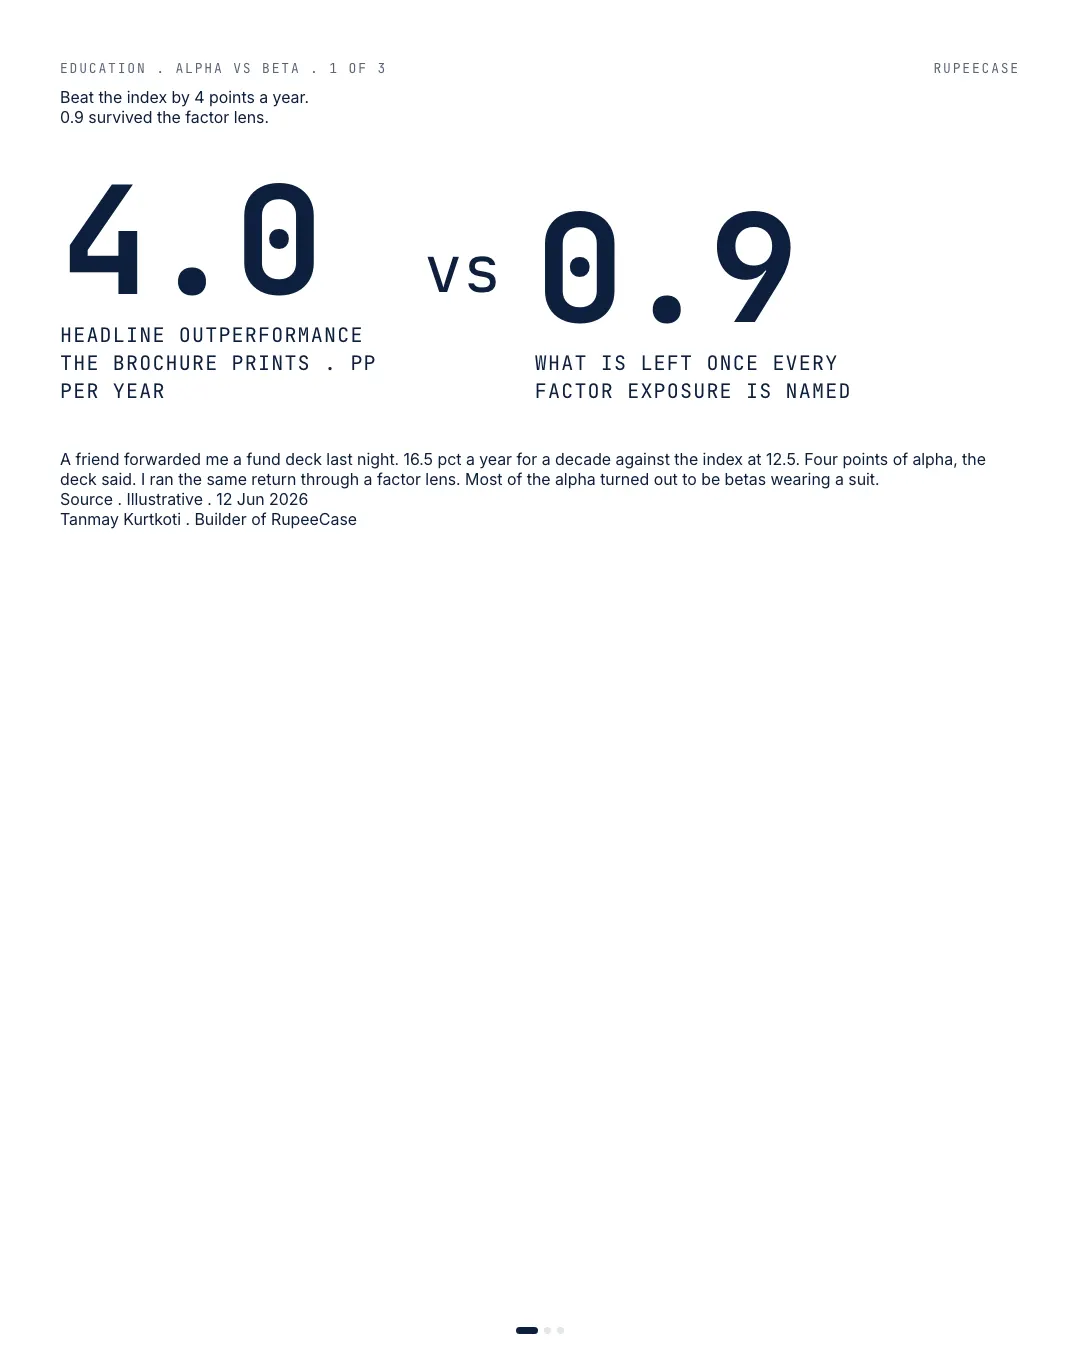
Four points of advertised alpha shrank to 0.9 after market beta, a midcap tilt and a momentum tilt were named, and those exposures rent for 0.2 percent a year.
By Tanmay Kurtkoti, founder of QC Alpha and builder of RupeeCase
A friend forwarded me a fund deck last night. 16.5 pct a year for ten years against the index at 12.5. Four points of alpha, the deck said. Compounding at that gap turns Rs 10L into Rs 46L instead of Rs 32L, so I understand why the number sells.
I ran the same return through a factor lens before replying.
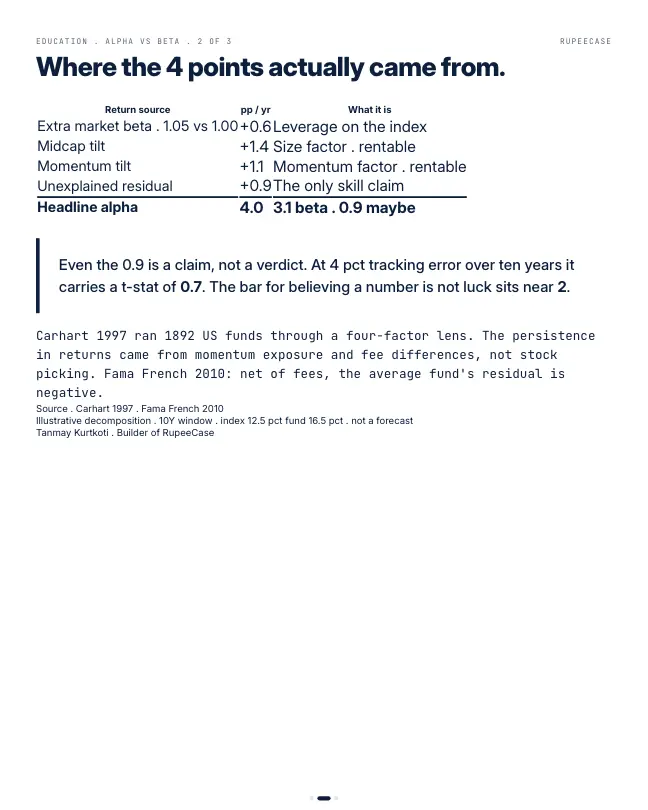
Extra market beta of 1.05 explained 0.6 points. A midcap tilt explained another 1.4. A momentum tilt explained 1.1 more. That is 3.1 of the 4 points accounted for by exposures, not decisions. Nobody picked a stock to earn them. The portfolio just leaned, and the factors paid.
What survived was 0.9 points of unexplained residual. The honest version: even that is a claim, not a verdict. At 4 pct tracking error over ten years, a 0.9 residual carries a t-stat of about 0.7. The bar for believing a number is not luck sits near 2. Carhart ran 1892 US funds through this exact lens in 1997 and found the persistence in returns came from momentum exposure and fee differences, not stock picking. Fama and French repeated the exercise in 2010. Net of fees, the average fund's residual is negative.
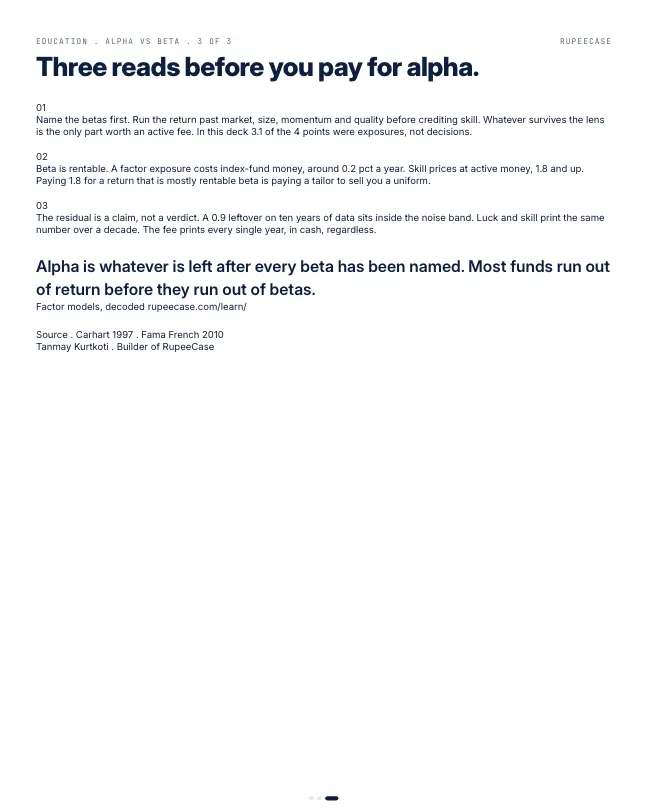
Here is the part that matters for your money. Every one of those exposures is rentable. A midcap or momentum index fund costs around 0.2 pct a year. This fund charged 1.8 for the package. On a Rs 10L holding that is Rs 18,000 a year against Rs 2,000, for ingredients that were never skill in the first place.
Alpha is whatever is left after every beta has been named. Most funds run out of return before they run out of betas.
The four points, taken apart
Here is the deck's number laid out the way I read it, one layer at a time. Every figure is from the worked example above, so you can redo it with a pencil.
- Extra market beta (1.05)0.6
- Midcap tilt1.4
- Momentum tilt1.1
- Unexplained residual0.9
Percentage points a year of the 4 point gap over the index. Worked example, not a real fund.
Now put rupees on it. Rs 10 lakh at the index's 12.5 percent for ten years is about Rs 32.5 lakh. At the fund's 16.5 percent it is about Rs 46.1 lakh. At 12.5 plus only the 0.9 point residual, 13.4 percent, it is about Rs 35.2 lakh. Roughly Rs 2.7 lakh of the Rs 13.6 lakh difference is the part that might be skill. The other Rs 10.9 lakh came from leaning.
Why 0.9 points over ten years is still not proof
The t-stat in the opening is simpler than it sounds. Divide the residual by the tracking error, the yearly wobble of the fund against its benchmark, then multiply by the square root of the number of years.
0.9 / 4 x square root of 10 = 0.225 x 3.16 = 0.71.
Flip it around and the problem gets clearer. To push a 0.9 point residual up to a t-stat of 2 at 4 percent tracking error, you need (2 x 4 / 0.9) squared = about 79 years of data. No fund manager has that. So a small residual over a decade is not evidence of skill, and it is not evidence of its absence either. It is noise sized.
The free Learn module on performance measurement covers tracking error, the information ratio and how long a record must be before it says anything, with a quiz at the end: Performance Measurement.
What leaning looks like on NSE's own indices
You do not need a fund deck to see how much a tilt alone can do. NSE publishes factor indices that are nothing but a lean, built by rule, with no one picking stocks.
From 31 Dec 2024 to 30 Sep 2026, by NSE closing prices, the Nifty 50 fell 4.33 percent. Over the same 21 months the Nifty500 Value 50 rose 12.96 percent and the Nifty200 Momentum 30 fell 10.07 percent. Almost flat, up 0.26 percent, was the Nifty Smallcap 250.
- Nifty500 Value 50+17.29
- Nifty Smallcap 250+4.59
- Nifty200 Momentum 30-5.74
Price return minus the Nifty 50 price return, in percentage points, 31 Dec 2024 to 30 Sep 2026. NSE bhavcopy index closes, dividends excluded.
A fund that simply leaned towards value in that window would have shown a gap over the Nifty 50 that looks like genius. A fund that leaned towards momentum would have looked like it lost its touch. Neither result says anything about stock picking. On daily returns over the same window, the betas to the Nifty 50 were 1.04 for the Value 50, 1.10 for the Smallcap 250 and 1.21 for the Momentum 30, and their tracking errors against it ran from 10.2 to 12.3 percent a year. That is far wider than the 4 percent in the deck, which is why a tilted portfolio can drift so far from its benchmark without anyone making a decision.
This is the flip side of the turnover tax on a factor: a lean costs little to hold through an index, and costs a lot when it is sold to you as skill.
The lens, step by step
- Fix the benchmarkSame universe, total return version, chosen before you look at the result.
- Take out betaBeta above 1 earns more in rising markets with no skill involved.
- Name every tiltSize, value, momentum, quality. Each one has an index you could hold.
- Look at the residualWhatever is left is the only candidate for skill.
- Test itResidual over tracking error, times root years. Near 2 starts to mean something.
- Price itCompare the fee gap with the residual. A 1.6 point fee gap eats a 0.9 point residual.
That last step is the one most people skip. In the opening example the fund charged 1.8 percent against about 0.2 for index exposure, a gap of 1.6 points a year. Even if the 0.9 point residual were real, the investor paid more for the package than the package's skill delivered. The related post on long only factor investing covers how those tilts behave when you hold them directly.
Questions readers ask
What is the difference between alpha and beta?
Beta is the part of a return that comes from moving with the market or with a known factor, such as small companies or recent winners. Alpha is what is left after all of those are accounted for. A fund can beat its index by 4 points a year and still have very little alpha if the gap came from leaning towards factors.
How many years of returns do you need to judge a fund manager?
It depends on how big the excess return is relative to its tracking error. A 0.9 point residual at 4 percent tracking error gives a t-stat of about 0.7 after ten years, and would need about 79 years to reach 2. Larger, steadier excess returns can be judged sooner.
What is a good information ratio?
The information ratio is excess return divided by tracking error. Above 0.5 is generally considered good and above 0.8 is rare over long periods. The worked example here, 0.9 points over 4 percent tracking error, has an information ratio of about 0.23.
The cards
3 cards. Swipe, or tap to open.
Explore next
Learn it properly, then see it applied.
Related
- The factor leg you can actually buyAcademic premiums are long short spreads; a long only fund keeps nearly all of size, about 60 percent of value and roughly half of momentum, wrapped in full market beta.Factors . . 5 min
- Multi factor stacking: the peak is at threeOn the same Nifty 200 universe, Value plus Momentum lifts Sharpe from 0.66 to 0.91, Quality adds 0.04, and the fourth and fifth factors subtract.Factors . . 5 min
- Value and momentum: the two factors that disagreeA 50/50 blend of a 0.29 Sharpe value sleeve and a 0.50 momentum sleeve lands at 0.79, because their returns run at roughly minus 0.50 correlation.Factors . . 5 min
Educational content only. Figures are illustrative and computed on historical or representative data for teaching purposes, not investment advice. Past performance does not guarantee future returns. Sourced from NSE, BSE, SEBI, AMFI and RBI public data.