

Factors..5 min read
Value and momentum: the two factors that disagree
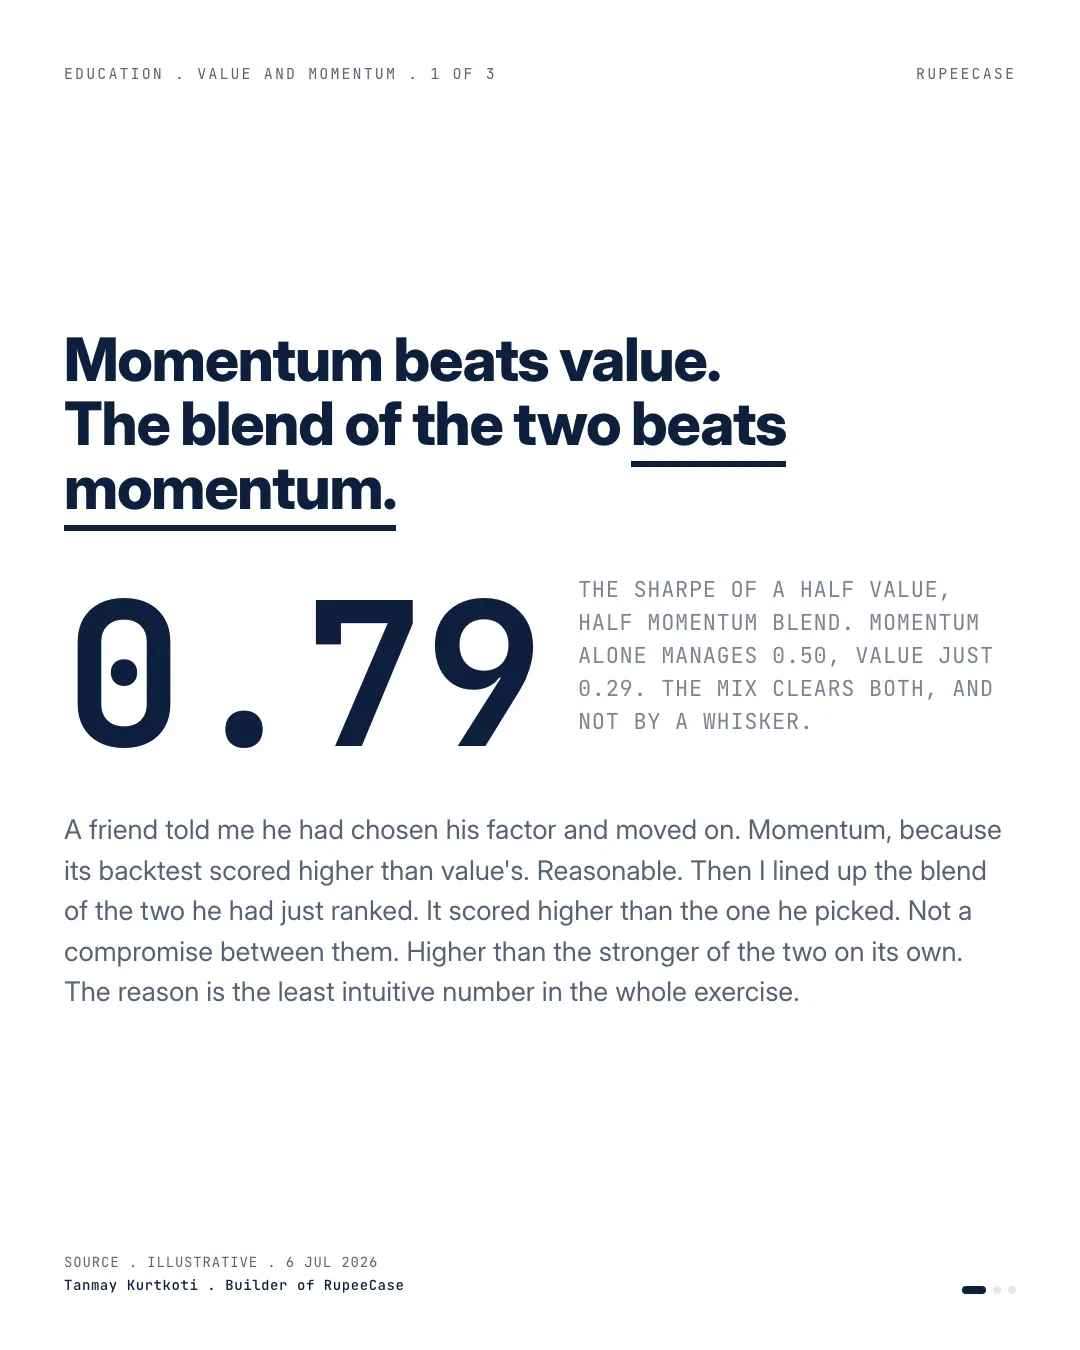
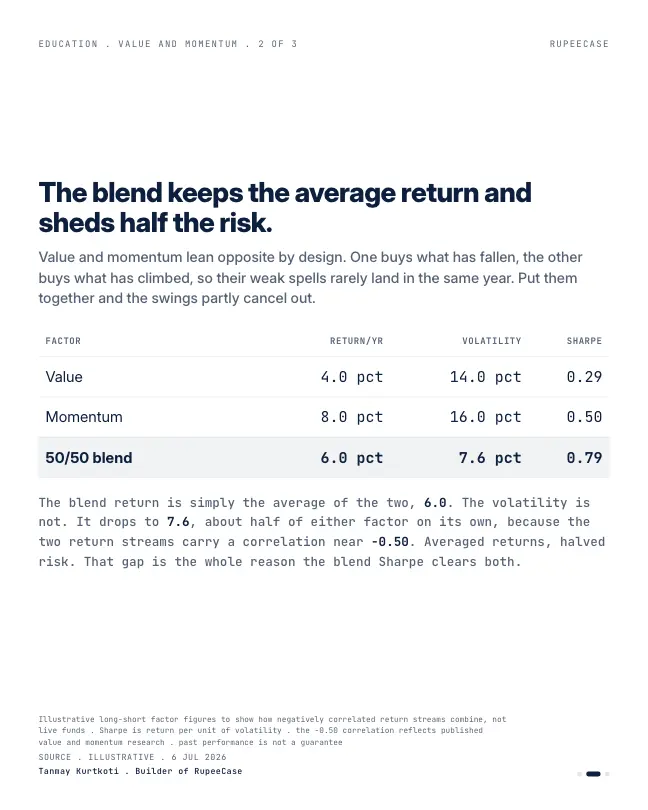
A 50/50 blend of a 0.29 Sharpe value sleeve and a 0.50 momentum sleeve lands at 0.79, because their returns run at roughly minus 0.50 correlation.
By Tanmay Kurtkoti, founder of QC Alpha and builder of RupeeCase
A friend told me he had picked his factor and was done.
Momentum, he said. He had compared the backtests, momentum's risk-adjusted return beat value's, so why hold the weaker one.
Reasonable. Then I showed him the blend of the two he had just ranked against each other.
Half in value, half in momentum. On the same illustrative numbers, value scores a Sharpe of 0.29 and momentum 0.50. You would expect a mix to land somewhere between them, closer to 0.40.
It lands at 0.79. Above both. And it is not a rounding error.
Here is why, and it is the least intuitive bit. Value buys what has fallen out of favour. Momentum buys what is already climbing. By construction the two lean in opposite directions, and their return streams have carried a correlation of roughly -0.50 across decades and markets (Asness, Moskowitz and Pedersen, "Value and Momentum Everywhere", 2013).
Negative correlation is the rarest thing in a portfolio. It means when value is having a bad year, momentum is often having a good one. Their weak spells do not overlap. So the combined return is just the average of the two, but the combined swing shrinks to about half of either factor on its own. Averaged return, halved risk. That is the whole reason the blend clears both.
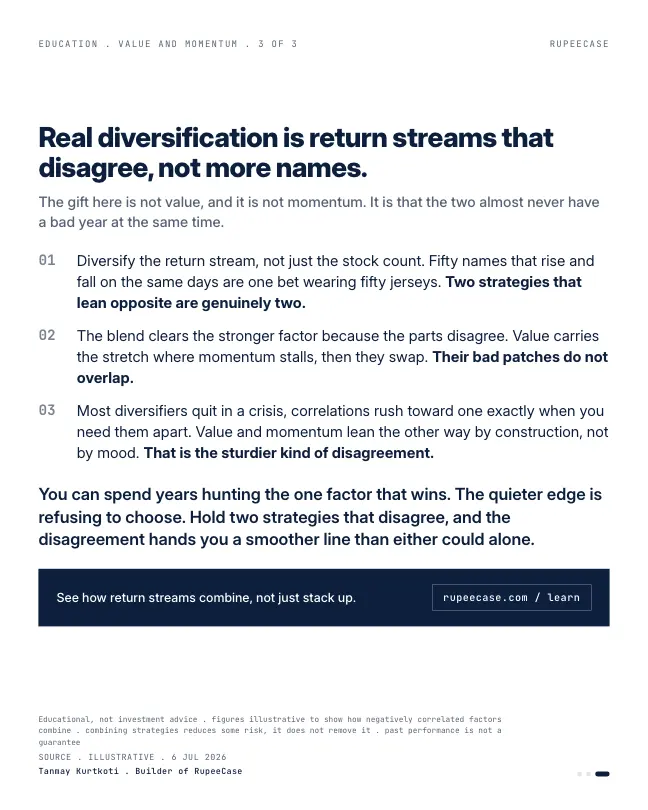
Most things you own crowd together exactly when you need them apart. Correlations rush toward one in a crisis. Value and momentum lean the other way on purpose, not on mood.
The lesson is not value, and it is not momentum. It is that diversification is a count of disagreements, not a count of names. The edge my friend was hunting was never picking the winner. It was refusing to choose
Where 0.79 comes from
The arithmetic fits on the back of a ticket. Assume both sleeves swing by the same amount, say 15 percent a year. Value earns 0.29 x 15 = 4.35 percent above cash, momentum 0.50 x 15 = 7.5 percent. Half in each earns the average, 5.9 percent.
The swing of the blend depends on the correlation. With equal swings, it is 15 x square root of ((1 + correlation) / 2). At a correlation of minus 0.5 that is 15 x square root of 0.25 = 7.5 percent. So the blend's Sharpe is 5.9 / 7.5 = 0.79.
Now the honest part. Change only the correlation and the magic fades. At 0 the blend scores 0.56. At plus 0.4 it is 0.47. At plus 0.8 it is 0.42, barely above the simple average. Everything in the opening rests on that one input.
What NSE's own indices show
The minus 0.5 in the research is for long short factor returns: the winners held and the losers sold short, so the market itself cancels out. An Indian investor holding index funds does not get that. A long only value index and a long only momentum index both own the market first and the factor second.
I measured it on NSE's closing data. From 31 Oct 2024 to 30 Sep 2026, the daily returns of the Nifty500 Value 50 and the Nifty200 Momentum 30 had a correlation of plus 0.81. Strip out the Nifty 50 from each, so you look only at the part above or below the market, and the correlation of those excess returns from 1 Jan 2025 to 30 Sep 2026 drops to plus 0.43. Lower, still positive. On a monthly view the excess returns pointed in opposite directions in 6 of 21 months.
| Index | Jan | Feb | Mar | Apr | May | Jun | Jul | Aug | Sep |
|---|---|---|---|---|---|---|---|---|---|
| Value 50 | 2.8 | 5.5 | -11.4 | 10.8 | 0.1 | -2.8 | 0.2 | -0.9 | -4.9 |
| Momentum 30 | -2.6 | 3.4 | -13.7 | 11.4 | 1.0 | 1.5 | -1.0 | 2.5 | -5.9 |
Monthly price returns of the Nifty500 Value 50 and Nifty200 Momentum 30, Jan to Sep 2026, from month end closes. NSE bhavcopy index history.
Read the table across. In January, June, July and August the two went opposite ways. In March 2026 both fell more than 11 percent together. That is the crisis pattern from the opening, in Indian data: when the whole market sells off, a long only factor sleeve goes with it.
Did the blend still help?
Yes, in the way that matters most to someone holding it. Over the same 23 months the Value 50 rose 6.0 percent, the Momentum 30 fell 14.5 percent, and a 50/50 mix, put back to half and half every day, fell 4.5 percent. Price only, before costs and tax.
- Nifty500 Value 50-18.56%
- Nifty200 Momentum 30-26.55%
- 50/50 blend-21.57%
Largest fall from a high, 31 Oct 2024 to 30 Sep 2026, daily closes, blend rebalanced daily, price only, before costs. RupeeCase calculation from NSE bhavcopy index history.
The blend did not beat value. Nothing in this window did. What it did was cut the worst fall from 26.6 percent to 21.6 percent compared with holding only the factor my friend had chosen. On the excess part alone, the blend's yearly swing against the Nifty 50 was 9.0 percent, against 11.0 for value and 10.2 for momentum. Smaller than either, as the formula says it should be, just not half.
So the opening is right about the direction and generous about the size. With a correlation of minus 0.5 you get the dramatic version. With the plus 0.4 an Indian long only investor actually got over these two years, you get a quieter one: a blend that is easier to sit through, not one that scores above both.
The free Learn module on combining factors walks through the correlation matrix, the two ways to build a multi factor portfolio and a quarterly 50/50 example on NSE indices: Combining Factors. For why a long only portfolio carries the market inside every factor, see the long only factor post, and for stacking more than two, multi factor stacking.
MythOwning more stocks, or more funds, is what diversifies a portfolio.
FactOnly holdings that move differently diversify. Two long only factor indices with a daily correlation of 0.81 behave much more like one holding than two.
Questions readers ask
Why do value and momentum have negative correlation?
Value buys stocks that have become cheap, which are often the recent losers, while momentum buys the recent winners. Their long short factor returns have run at roughly minus 0.5 correlation in published research. Long only index versions share the market's moves, so their correlation is positive: plus 0.81 on daily NSE data from Oct 2024 to Sep 2026.
How do you calculate the Sharpe ratio of a 50/50 portfolio?
Take the average excess return of the two sleeves and divide by the blend's volatility. With equal volatilities, the blend's volatility is the single volatility times the square root of (1 plus correlation) divided by 2. Two sleeves with Sharpe ratios of 0.29 and 0.50 give 0.79 at minus 0.5 correlation and 0.47 at plus 0.4.
Does combining factors reduce drawdowns?
It usually reduces the worst fall compared with the weaker factor, because the factors rarely hit bottom at the same moment. From Oct 2024 to Sep 2026 a daily rebalanced 50/50 mix of the Nifty500 Value 50 and Nifty200 Momentum 30 fell 21.6 percent at worst, against 26.6 percent for momentum alone, but more than value's 18.6 percent.
The cards
3 cards. Swipe, or tap to open.
Explore next
Learn it properly, then see it applied.
Related
- The factor leg you can actually buyAcademic premiums are long short spreads; a long only fund keeps nearly all of size, about 60 percent of value and roughly half of momentum, wrapped in full market beta.Factors . . 5 min
- Alpha is beta in disguiseFour points of advertised alpha shrank to 0.9 after market beta, a midcap tilt and a momentum tilt were named, and those exposures rent for 0.2 percent a year.Factors . . 6 min
- Multi factor stacking: the peak is at threeOn the same Nifty 200 universe, Value plus Momentum lifts Sharpe from 0.66 to 0.91, Quality adds 0.04, and the fourth and fifth factors subtract.Factors . . 5 min
Educational content only. Figures are illustrative and computed on historical or representative data for teaching purposes, not investment advice. Past performance does not guarantee future returns. Sourced from NSE, BSE, SEBI, AMFI and RBI public data.