

Factors..5 min read
Multi factor stacking: the peak is at three
On the same Nifty 200 universe, Value plus Momentum lifts Sharpe from 0.66 to 0.91, Quality adds 0.04, and the fourth and fifth factors subtract.
By Tanmay Kurtkoti, founder of QC Alpha and builder of RupeeCase
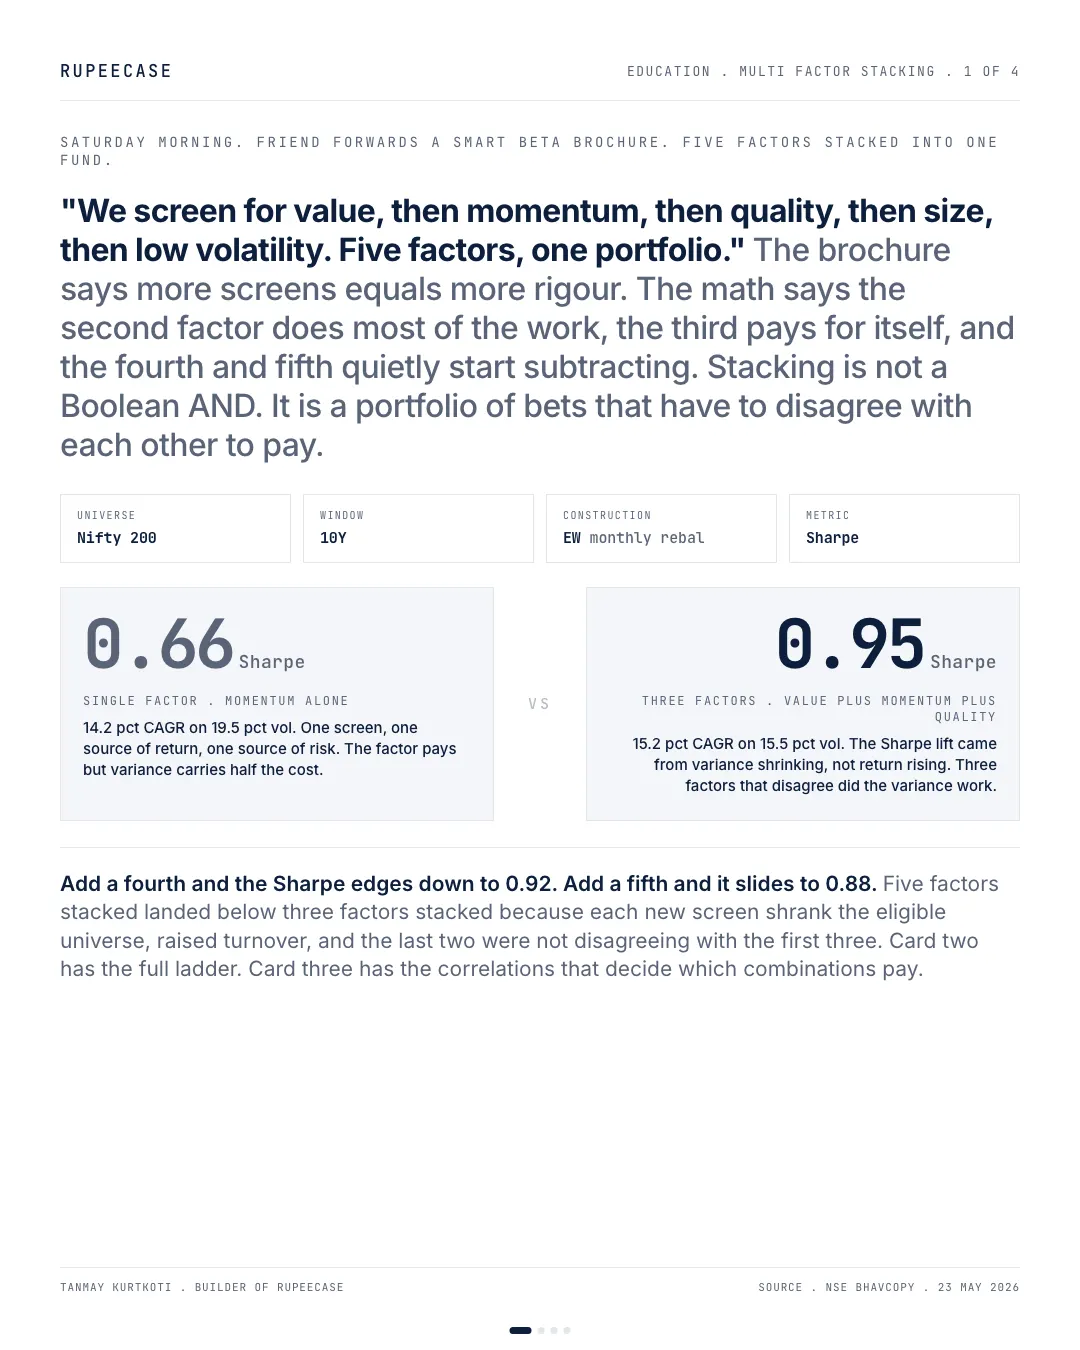
Saturday morning. Friend forwards a smart beta brochure. Five factors stacked into one fund. Value. Momentum. Quality. Size. Low volatility. The cover sells it as more screens, more rigour. He wants to know if it is worth the 1.4 pct TER.
The instinctive answer is yes. The math says wait.
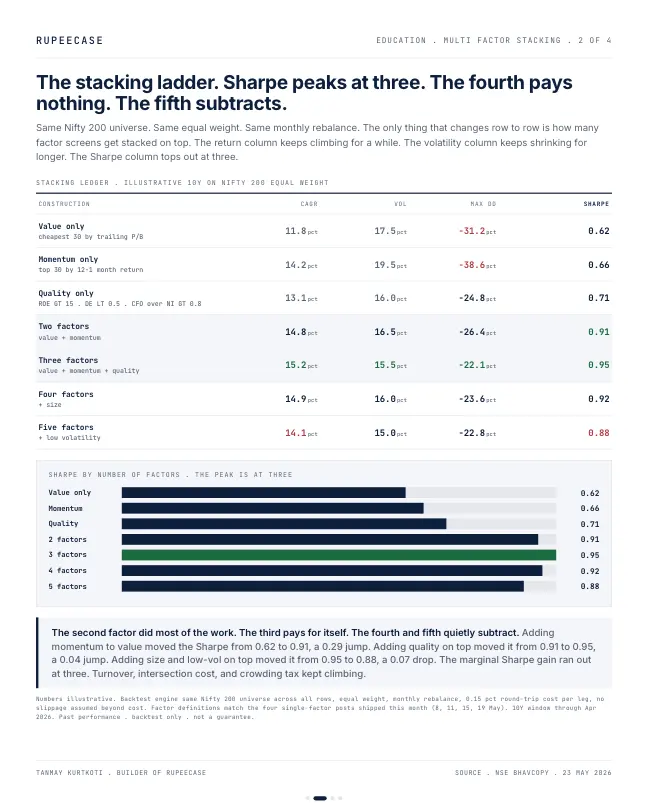
Run the same Nifty 200 universe through every combination, same equal weight, same monthly rebalance, only the number of factor screens changes row to row. Value alone lands at Sharpe 0.62. Momentum alone at 0.66. Quality alone at 0.71. Stack Value and Momentum together and the Sharpe jumps to 0.91, a 0.29 lift on the back of one added screen. Add Quality on top and Sharpe edges to 0.95, a 0.04 lift. Add Size, the fourth screen, and Sharpe drops to 0.92. Add Low Volatility, the fifth, and Sharpe slides further to 0.88.
The peak is at three. The fourth pays nothing. The fifth subtracts.
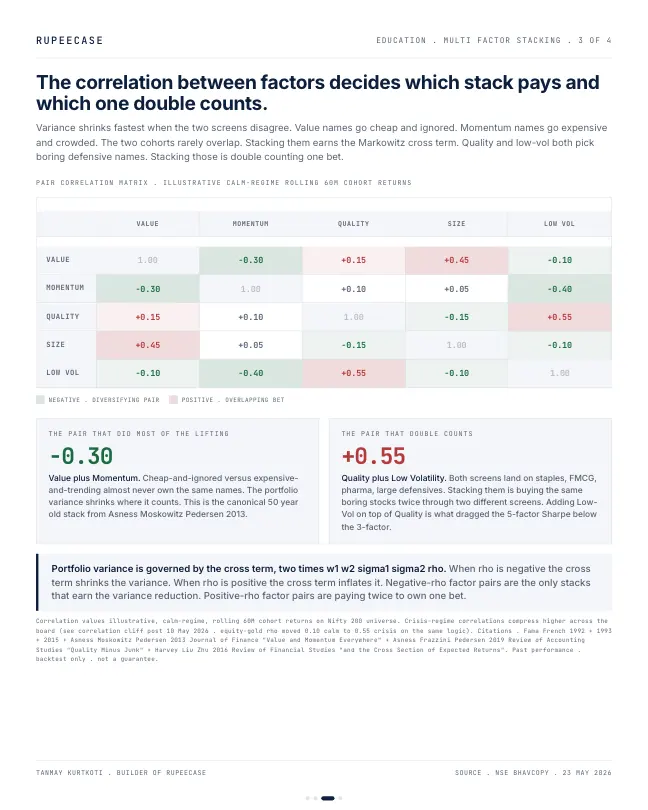
The reason is correlation, not magic. Value sits at minus 0.30 with Momentum because cheap-and-ignored almost never overlaps with expensive-and-trending. The variance of the combined portfolio is governed by the cross term, two times w1 w2 sigma1 sigma2 rho, and rho being negative is what shrinks variance. Stacking those two earns the Markowitz reduction. Quality sits at plus 0.55 with Low Volatility because both screens land on the same defensive cohort. Staples, FMCG, pharma, large defensives. Stacking those is buying the same boring stocks twice through two different doors. The 5-factor portfolio looked diversified on paper. The math priced it as one bet plus three near-copies.
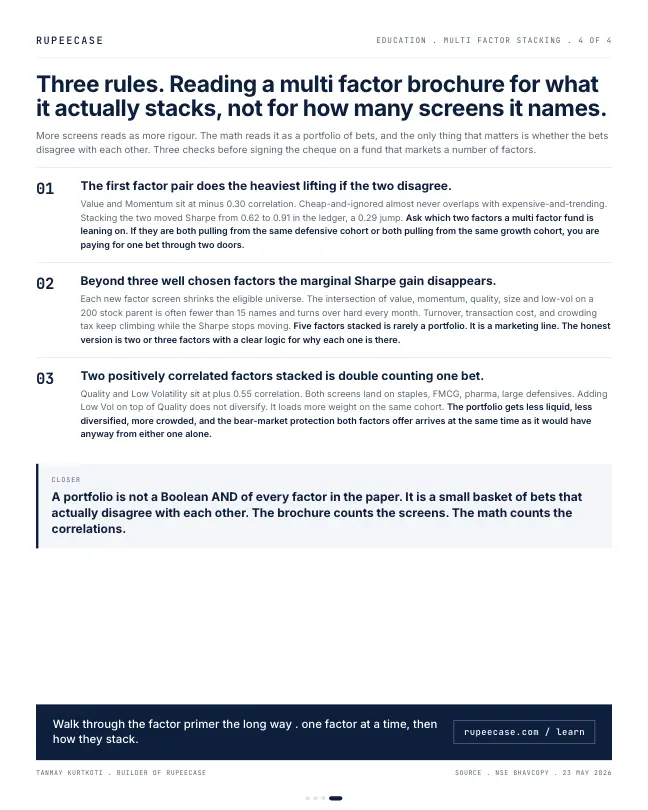
Three checks before signing a cheque on a multi factor fund. Ask the correlation between the named factors. Two screens that disagree is the only stack that earns the variance reduction. Treat anything past three factors as marketing rather than math. The marginal Sharpe gain disappears while turnover and crowding tax keep climbing. Avoid Quality plus Low Vol unless you actually want two defensive screens. The brochure call them two factors. The portfolio gets one.
A portfolio is not a Boolean AND of every factor in the paper. It is a small basket of bets that actually disagree with each other.
The ladder from the opening
Put the opening's numbers on one chart and the shape is plain. The big jump comes from the first pair that disagrees. After three, each extra screen costs more than it adds.
- Momentum alone0.66
- Value plus momentum0.91
- Plus quality0.95
- Plus size0.92
- Plus low volatility0.88
Sharpe ratio by number of screens, Nifty 200 universe, equal weight, monthly rebalance. Back test figures quoted in the opening of this post, illustrative.
The cross term, worked by hand
Here is the formula from the opening with numbers you can check. Two sleeves, half your money in each. Sleeve one swings 18 percent a year, sleeve two 16 percent. The blend's variance is 0.5 squared times 18 squared, plus 0.5 squared times 16 squared, plus the cross term: 2 x 0.5 x 0.5 x 18 x 16 x the correlation.
At a correlation of minus 0.3, the cross term is minus 43.2 and the blend swings about 10.1 percent a year. At plus 0.55, the quality and low volatility case, the cross term is plus 79.2 and the blend swings about 15.0 percent, barely below either sleeve. Same weights, same sleeves. Only the correlation moved.
Try 0.78. That is roughly the correlation of the quarterly returns of NSE's long only momentum and value indices over the eight quarters to October 2026. The minus 0.3 in the opening describes long short factor premiums, where the market is cancelled out. Long only indices carry the market inside every sleeve, so their raw returns move together far more.
What NSE's indices show
Even at a positive correlation, the blend still helped where it mattered. Hold the Nifty200 Momentum 30 and the Nifty200 Value 30 half and half from October 2024, putting the weights back each quarter. Momentum fell about 30 percent at quarterly points and ended at 78.5. Value ended at 100.9. The blend ended at 89.5, and its worst quarterly fall was about 22 percent.
Rebased to 100 in Oct 2024: momentum 78.5, value 100.9 and the quarterly rebalanced 50/50 blend 89.5 in Oct 2026.
RupeeCase calculation from NSE index closes on the 9th of each quarter month, 9 Oct 2024 to 9 Oct 2026, price only, blend rebalanced quarterly, before costs.
NSE also publishes the other way of building a stack. Instead of two sleeves side by side, a composite index scores every stock on two factors at once and keeps the stocks that do well on both. The Nifty Alpha Low-Volatility 30 combines a momentum style alpha score with low volatility.
Two portfolios, one account
- 50 percent in a momentum portfolio, 50 percent in value
- Each ranked on its own factor
- Weights put back on a schedule
One score, one portfolio
- Each stock scored on both factors
- Keeps stocks strong on both at once
- NSE example: Nifty Alpha Low-Volatility 30
On its factsheet of 30 Sep 2026, the Alpha Low-Volatility 30 had compounded at 17.71 percent a year on total return since 2005, back calculated before its 2017 launch, with five year volatility of 13.4 percent. The single factor Nifty200 Momentum 30 earned 18.30 percent with five year volatility of 19.4 percent. Almost the same long run return, about a third less swing. Two factors that disagree, not five that agree.
The free Learn module on combining factors builds both versions step by step on NSE indices, with a quiz. The posts on value and momentum disagreeing and long only factors go deeper into why a long only blend behaves differently from the research.
Questions readers ask
How many factors should a multi factor portfolio have?
There is no fixed number, but the benefit comes from factors that disagree, not from the count. In the back test quoted here, the Sharpe ratio peaked at three screens and fell with the fourth and fifth, because the extra factors overlapped with ones already held.
Why do quality and low volatility overlap?
Both screens tend to pick the same kind of company: steady earnings, low debt and smaller price swings. With a correlation around plus 0.55, holding both adds little diversification, because the second screen buys many of the same stocks as the first.
What is the difference between a multi factor index and a blend of factor funds?
A blend holds separate factor portfolios side by side and rebalances between them. A multi factor index scores each stock on several factors at once and holds the stocks that score well on all of them. NSE's Nifty Alpha Low-Volatility 30 is an example of the composite approach.
The cards
4 cards. Swipe, or tap to open.
Explore next
Learn it properly, then see it applied.
Reading path
Stop 6 of 8 on Factor primer
Related
- Alpha is beta in disguiseFour points of advertised alpha shrank to 0.9 after market beta, a midcap tilt and a momentum tilt were named, and those exposures rent for 0.2 percent a year.Factors . . 6 min
- The factor leg you can actually buyAcademic premiums are long short spreads; a long only fund keeps nearly all of size, about 60 percent of value and roughly half of momentum, wrapped in full market beta.Factors . . 5 min
- Value and momentum: the two factors that disagreeA 50/50 blend of a 0.29 Sharpe value sleeve and a 0.50 momentum sleeve lands at 0.79, because their returns run at roughly minus 0.50 correlation.Factors . . 5 min
Educational content only. Figures are illustrative and computed on historical or representative data for teaching purposes, not investment advice. Past performance does not guarantee future returns. Sourced from NSE, BSE, SEBI, AMFI and RBI public data.