

Factors..5 min read
The factor leg you can actually buy
Academic premiums are long short spreads; a long only fund keeps nearly all of size, about 60 percent of value and roughly half of momentum, wrapped in full market beta.
By Tanmay Kurtkoti, founder of QC Alpha and builder of RupeeCase
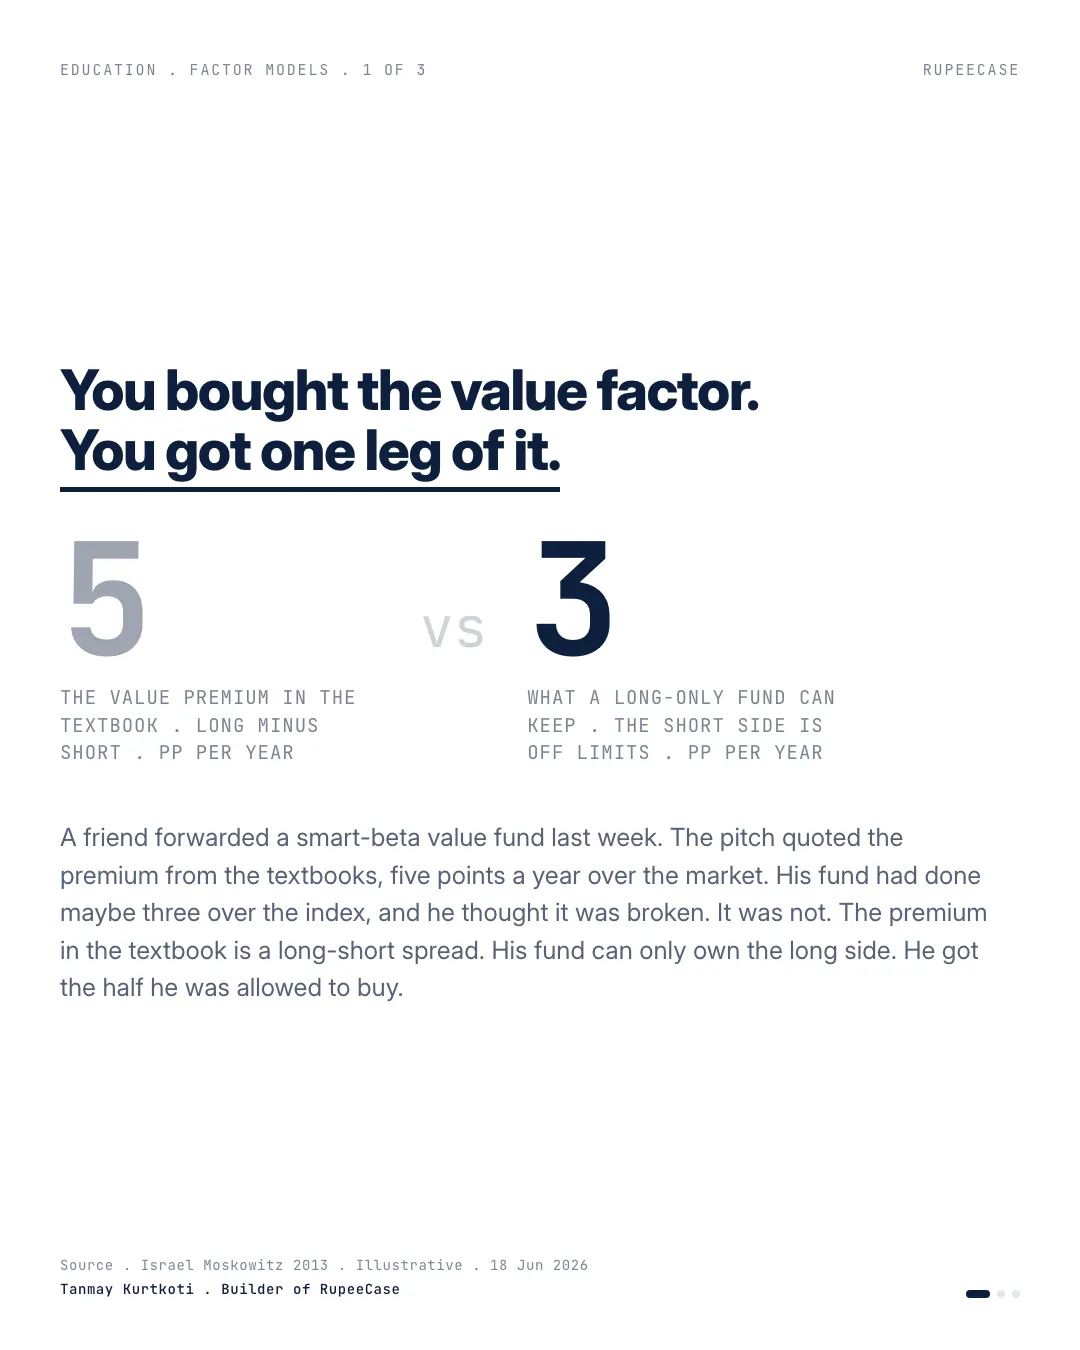
A friend forwarded a smart-beta value fund last week. The pitch leaned on the value premium from the textbooks, something like five points a year over the market across decades of data. His fund had done maybe three points over the index, and he was ready to sell it for underperforming.
I told him to stop. He hadn't bought a bad fund. He'd bought one leg of a two-legged trade.
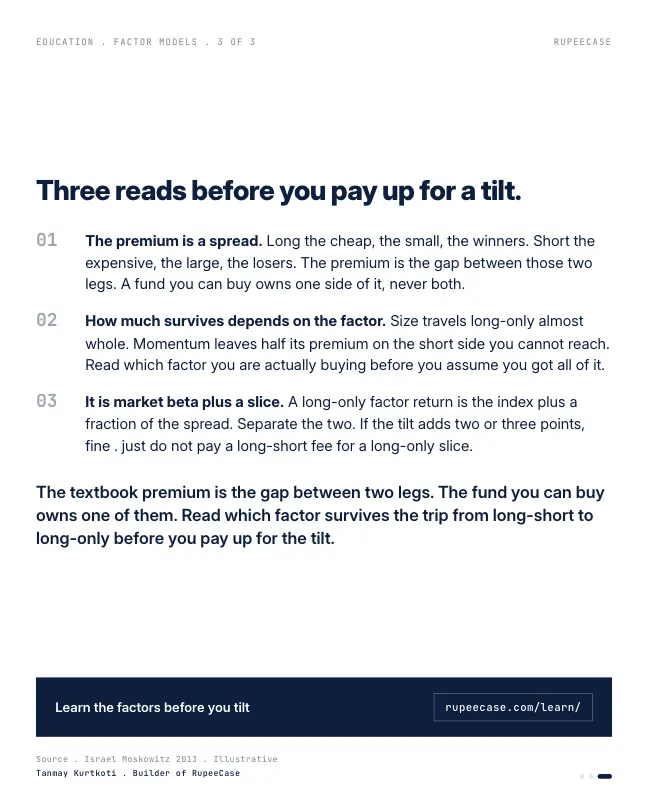
Here is the part the brochure skips. Every factor premium in the academic literature is a long-short spread. You go long the cheap stocks and short the expensive ones. Long the small, short the large. Long the recent winners, short the recent losers. The premium is the distance between those two baskets, not the return of either one on its own.
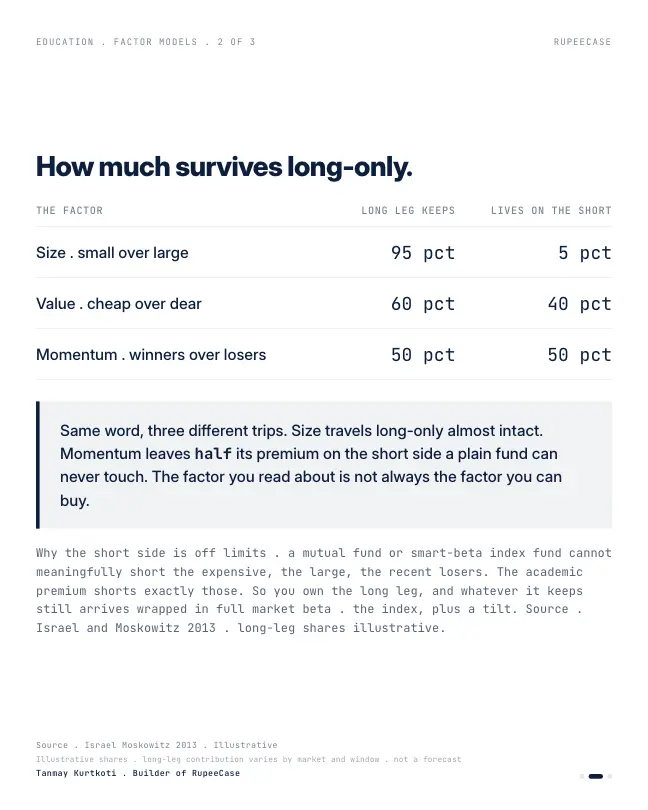
A plain mutual fund or a smart-beta index fund can't short anything. So it owns the long leg and leaves the short leg on the table. And how much of the premium actually lives on the long side depends entirely on the factor. The long leg keeps almost all of the size premium, around 60 percent of value, and only about half of momentum (Israel and Moskowitz, 2013). Same word, three very different trips from the paper to your portfolio.
Then there is the quieter problem. Whatever the long leg keeps still arrives wrapped in full market beta. A long-only value fund is the index plus a tilt, not the value premium standing alone. Strip the beta and the tilt is smaller than the sticker.
None of this makes factor funds bad. It just means you should know which leg you are buying and how much of the premium survives before you pay an active fee for it. Two or three points of genuine tilt over the index is worth having. Paying a long-short price for a long-only slice is not.
Two legs on paper, one leg in your account
The picture is simple once you draw it. The research portfolio holds two baskets at the same time and earns the gap between them. The market moves both baskets together, so the market cancels out. What is left is the factor and only the factor.
A fund that cannot short gets the right hand picture. Most of what it earns in any year is the market. The factor is the thin band on top, and that band is also smaller than the paper premium because the short leg's share never arrives.
The beta is printed on NSE's own factsheets
You do not have to take this on trust. NSE publishes a five year beta to the Nifty 50 for each of its factor indices. Beta tells you how much an index moves for each 1 percent move in the market.
Nifty200 Value 30, five year beta to the Nifty 50
NSE Indices factsheet, 30 Sep 2026
Nifty200 Momentum 30, five year beta
NSE Indices factsheet, 30 Sep 2026
NIFTY200 Quality 30, five year beta
NSE Indices factsheet, 30 Sep 2026
None of them sits near zero, which is where a pure long short factor lives. The value and momentum indices swing more than the market. Quality swings less. Every one of them is, first, a way of owning Indian large and mid caps.
Strip the beta from my friend's three points
Here is the worked example, in the opening's own numbers. Say the index did 12 percent a year and the fund did 15, the three points my friend was unhappy with. Say the fund's beta is 1.1 and cash earns 6.5 percent a year. Both are assumptions for the arithmetic, not his fund's figures.
Step one: the part the market explains. Cash plus beta times the market's return above cash: 6.5 + 1.1 x (12 minus 6.5) = 12.55 percent. Step two: the tilt is what is left. 15 minus 12.55 = 2.45 points. The sticker said three. A fund with a beta above one earns part of its lead just by swinging harder in a rising year, and gives it back in a falling one.
Try a year where the index falls. Put the index at minus 10 and the fund at minus 9. The fund looks one point better, but with a beta of 1.1 the market alone would have taken it to minus 11.65, so the tilt was worth 2.65 points. Beta flatters a fund in rallies and hides it in falls. Read the tilt, not the gap.
The tilt is real, and it is not steady
The last five years on NSE show both halves of the opening. Each of these is a long only index, total return, measured against its own parent universe.
- Nifty200 Value 3022.91%
- Nifty200 Momentum 309.28%
- Nifty 200 (parent)8.30%
- NIFTY200 Quality 306.40%
Total return CAGR over the 5 years to 30 Sep 2026. NSE Indices factsheets, 30 Sep 2026. Index history, not a promise of future returns.
Value was 14.6 points a year ahead of its parent. Momentum was about one point ahead. Quality trailed by 1.9 points. All three still owned the market first, which is why a long only factor index can lag for years while the paper factor looks fine. The free module on introduction to factors sets out what each factor owns, with the P/E, P/B and beta of each NSE index side by side.
The same logic decides how a blend behaves. Two long only factors share the market, so they move together more than the research says they should. I worked through that on NSE data in the value and momentum post, and the case for holding several tilts at once is in multi factor stacking.
Questions readers ask
What is the difference between long only and long short factor returns?
A long short factor holds the stocks the rule likes and sells short the ones it dislikes, so the market's move cancels out and only the factor remains. A long only fund or index holds just the liked stocks, so it earns the market plus a tilt. NSE's factor indices carry five year betas of 0.82 to 1.18 to the Nifty 50 (factsheets, 30 Sep 2026).
How do you measure the real tilt of a smart beta fund?
Take the fund's return and subtract what its beta alone would have earned: cash plus beta times the index's return above cash. A fund that returns 15 percent against an index at 12, with a beta of 1.1 and cash at 6.5, has a tilt of 2.45 points, not 3.
Why can a value index lag the market for years if the value premium is real?
Because a long only value index is mostly market, and its tilt arrives unevenly. Over the five years to 30 Sep 2026 the Nifty200 Value 30 led its parent by 14.6 points a year, while the NIFTY200 Quality 30 trailed by 1.9 points over the same years.
The cards
3 cards. Swipe, or tap to open.
Related
- Alpha is beta in disguiseFour points of advertised alpha shrank to 0.9 after market beta, a midcap tilt and a momentum tilt were named, and those exposures rent for 0.2 percent a year.Factors . . 6 min
- Value and momentum: the two factors that disagreeA 50/50 blend of a 0.29 Sharpe value sleeve and a 0.50 momentum sleeve lands at 0.79, because their returns run at roughly minus 0.50 correlation.Factors . . 5 min
- Multi factor stacking: the peak is at threeOn the same Nifty 200 universe, Value plus Momentum lifts Sharpe from 0.66 to 0.91, Quality adds 0.04, and the fourth and fifth factors subtract.Factors . . 5 min
Educational content only. Figures are illustrative and computed on historical or representative data for teaching purposes, not investment advice. Past performance does not guarantee future returns. Sourced from NSE, BSE, SEBI, AMFI and RBI public data.