

Factors..5 min read
Last year's best factor is a bad forecast
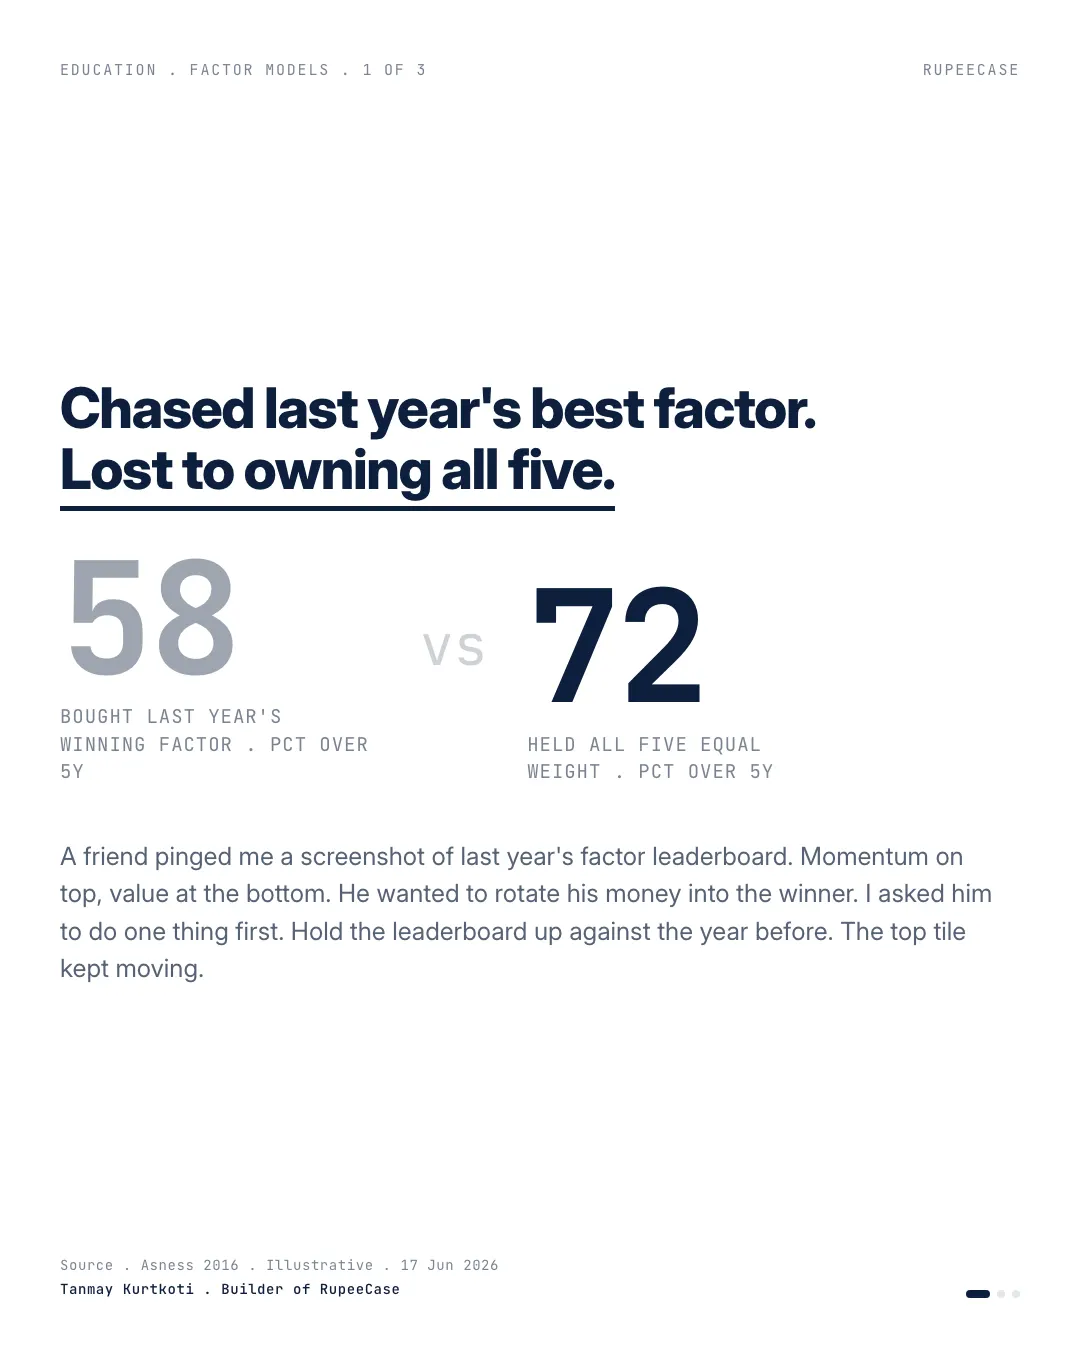
Buying the prior year's leading factor compounded to about 58 percent over five years while an equal weight blend of all five made 72, because the leader repeated once in five tries.
By Tanmay Kurtkoti, founder of QC Alpha and builder of RupeeCase
A friend sent me last year's factor leaderboard this week. Momentum on top, value scraping the bottom. He wanted to rotate his SIP into the winner. Reasonable instinct. It is also the single most common way people lose to a portfolio that does nothing clever.
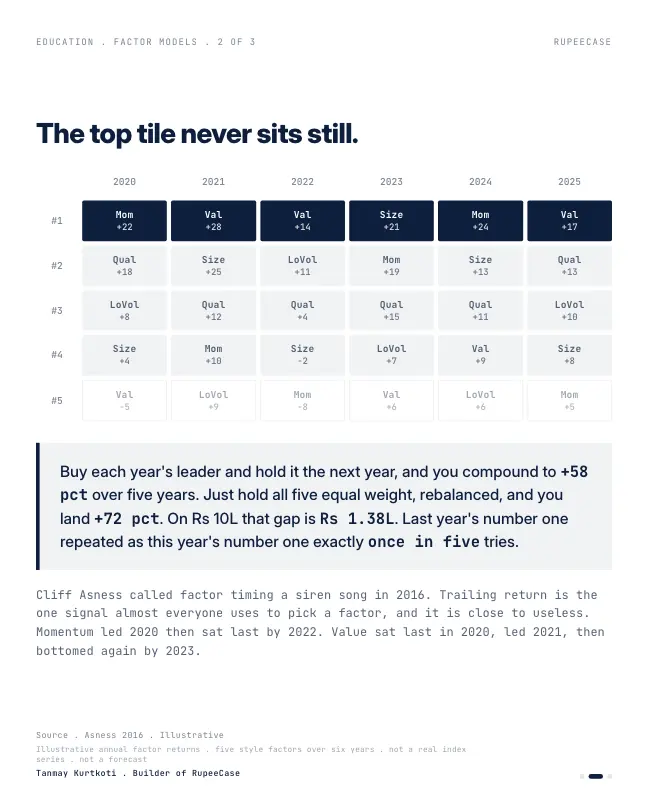
I asked him to do one thing first. Hold last year's leaderboard up against the year before it. The top tile had moved. It almost always has.
So I ran the trade he was about to make. Every year, buy whatever factor led the year before, hold it, repeat. Over five years that compounds to roughly +58 percent. Then I ran the lazy version. Hold all five factors, equal weight, rebalance on a schedule, never look at the leaderboard. +72 percent. Same five factors. On a 10 lakh book that is about 1.4 lakh of compounding handed away for the privilege of feeling decisive.
The reason is in the rotation. Across those years, last year's number one repeated as this year's number one exactly once in five tries. Momentum led one year and sat dead last two years later. Value bottomed, led, then bottomed again. Trailing return is a baton in the middle of a handoff. Chase it and you grab it right as it leaves the hand.
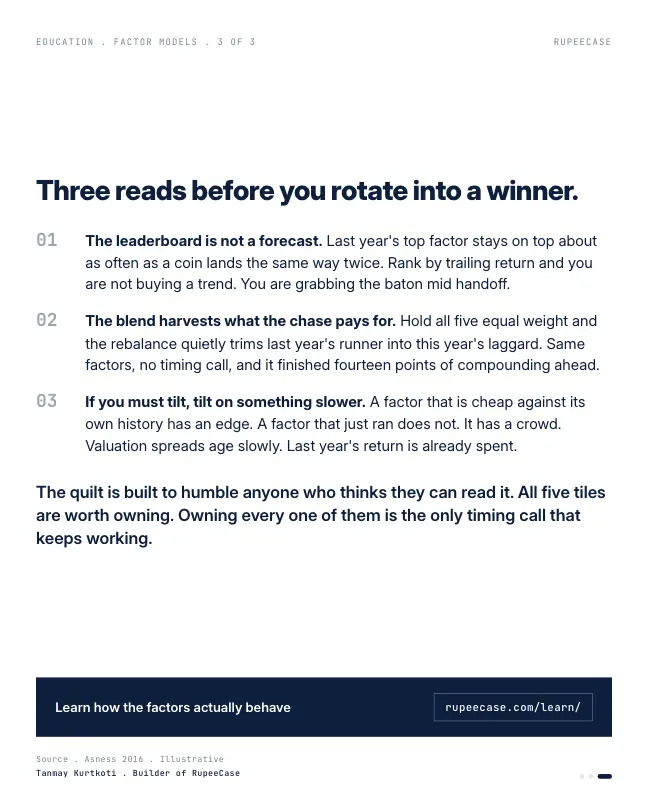
The blend wins because the rebalance quietly does what you cannot make yourself do. It trims the runner and buys the laggard, on a calendar, with no opinion attached. Cliff Asness called factor timing a siren song back in 2016, and the trailing-return version is the loudest verse.
If you genuinely want to tilt, tilt on something slower than last year. How cheap a factor sits against its own history. That signal ages in years. A hot twelve months is already spent.
The opening's two paths, in rupees
Put the two results on the Rs 10 lakh book. Chasing last year's leader turned it into about Rs 15.8 lakh, a yearly rate of about 9.6 percent. The equal weight blend turned it into about Rs 17.2 lakh, about 11.5 percent a year. Two points a year sounds small. Over five years it is Rs 1.4 lakh, and over twenty it would be far more.
The leader depends on the window you pick
The leaderboard my friend sent was one window. Change the window and the board reshuffles. Here are NSE's factor indices on three windows ending 9 Oct 2026.
| Index | 6 months | 1 year | 2 years |
|---|---|---|---|
| Nifty Alpha 50 | 13.5 | 9.5 | -7.5 |
| Smallcap 250 | 13.4 | 3.3 | -2.9 |
| Value 30 | -8.4 | 2.4 | 0.9 |
| Momentum 30 | -2.2 | -5.9 | -21.5 |
| Quality 30 | -3.7 | -9.3 | -17.5 |
| Low Vol 30 | -3.8 | -8.3 | -10.1 |
| Nifty 500 | -0.8 | -5.9 | -7.3 |
Price return to 9 Oct 2026. Nifty Alpha 50, Nifty Smallcap 250, Nifty200 Value 30, Nifty200 Momentum 30, NIFTY200 Quality 30, Nifty100 Low Volatility 30, Nifty 500. NSE index closes.
Read down each column. Over six months the Nifty Alpha 50 led and value was last. Over two years value led and the Momentum 30 was last. Over five years to 30 Sep 2026 on NSE's factsheets the order changed again, with value first at 22.9 percent a year on total return and quality last at 6.4 percent. Any of these is a true leaderboard. None of them tells you the next one.
Eight quarters of handoffs
Here is the same rotation, quarter by quarter, on four of those indices: momentum, value, quality and low volatility. The leader changed five times in eight quarters.
- Low Vol 30 led, down 6.6%
Every factor fell; the calmest fell least. Momentum lost 15.3%.
- Value 30 led, down 2.8%
Momentum lost another 16.9%.
- Momentum 30 led, up 20.2%
Last quarter's worst became this quarter's best.
- Value 30 led, up 2.4%
Momentum slipped 1.5%.
- Value 30 led twice in a row
Up 7.5% and then 4.0% while quality fell 8.1%.
- Low Vol 30 led, up 3.0%
Value dipped 1.4%.
- Momentum 30 led, down 3.6%
Least bad in a falling quarter; value fell 7.1%.
The honest part
I ran the chase on these eight quarters too: hold last quarter's leader for the next quarter, against an equal blend of all four put back to a quarter each every quarter. Last quarter's leader repeated in 2 of 7 tries. Yet this time the chase finished ahead, at 96.1 against 88.0 for the blend, rebased to 100, price only and before costs. The reason is one long run: value led four of the eight quarters, and a chaser who happened to be holding it rode most of that.
quarters where the last leader led again
NSE index closes, Oct 2024 to Oct 2026
chasing the leader, from 100
Price only, before costs
equal blend of four, from 100
Price only, before costs
So the evidence cuts both ways in a short window. Chasing wins when one factor has a long run and loses when leadership flips quickly, as it did in the opening's five years. You only find out which kind of period you were in afterwards, and the chaser also pays tax and costs on every switch, which the blend avoids between rebalances. That is why the free Learn module on factor timing and cycles focuses on slow signals such as valuation spreads, not last year's return. The posts on factor timing and long only factors take it further, and the drift threshold calculator shows when a blend has drifted far enough to rebalance.
Questions readers ask
Does buying last year's best performing factor work?
Not reliably. In the five year test in the opening, last year's leader repeated once in five tries and the chase trailed an equal blend by 14 percentage points. In a shorter NSE window from Oct 2024 to Oct 2026 the chase came out ahead because value led for most of a year, which shows how much the result depends on the period.
Which factor has done best in India recently?
It depends on the window. To 9 Oct 2026, the Nifty Alpha 50 led over six months, the Nifty200 Value 30 over two years, and value again over five years to 30 Sep 2026 on NSE's factsheets, while momentum was last over two years.
What is the alternative to timing factors?
Holding several factors at fixed weights and rebalancing on a schedule. The rebalance sells part of whatever has run up and adds to what has lagged, without a forecast. Some investors tilt the weights slowly using valuation spreads, which change over years rather than months.
The cards
3 cards. Swipe, or tap to open.
Explore next
Learn it properly, then see it applied.
Related
- Factor timing is a rear view mirrorAcross ten years the prior year's leading factor repeated only three times in nine hand offs, while an equal weight blend of five earned about 10.5 percent with a worst year of minus 1.6.Factors . . 5 min
- The factor leg you can actually buyAcademic premiums are long short spreads; a long only fund keeps nearly all of size, about 60 percent of value and roughly half of momentum, wrapped in full market beta.Factors . . 5 min
- Alpha is beta in disguiseFour points of advertised alpha shrank to 0.9 after market beta, a midcap tilt and a momentum tilt were named, and those exposures rent for 0.2 percent a year.Factors . . 6 min
Educational content only. Figures are illustrative and computed on historical or representative data for teaching purposes, not investment advice. Past performance does not guarantee future returns. Sourced from NSE, BSE, SEBI, AMFI and RBI public data.