

Your momentum strategy returned 32% last year. Was that good? You cannot answer without three more numbers: what the benchmark returned, how much risk you took to get there, and whether the return came from your signal or simply from the market going up.
Performance measurement is the habit of asking those questions honestly. The investment industry has a long record of making performance look better than it was, through a soft benchmark, a flattering start date, or returns before costs. Here is how I read any return number, including the ones on this site.
The right benchmark
Every return number is meaningless without a benchmark. The benchmark answers one question: what would you have earned without this strategy, taking the same kind of risk?
For a factor strategy that picks from the Nifty 500, the fair benchmark is the Nifty 500 TRI (Total Return Index), not the Nifty 50 and not a price index. Two reasons:
- TRI, not price index. A price index ignores dividends. The TRI assumes they are reinvested. Your strategy's returns include dividends, so the benchmark must too, or you get a fake alpha of roughly the dividend yield every year. On the Nifty 50 that yield was 1.24% as of 8 Oct 2026 (NSE index data). SEBI has required mutual funds to benchmark against the TRI variant since 1 February 2018 for exactly this reason.
- Same universe, same risk. A strategy that buys mid and small caps takes more risk than the Nifty 50. Comparing it with the Nifty 50 credits it with the extra return that simply comes from owning smaller, riskier companies. Compare like with like: a midcap strategy against the Nifty Midcap 150 TRI, an all cap one against the Nifty 500 or Nifty Total Market TRI.
- Define the universeNifty 50, 100, 500, Midcap 150.
- Use TRI, not priceDividends reinvested.
- Match the riskBeta, size, sector.
- Include all costsSTT, charges, fees, tax.
- Fix it upfrontNever re-pick it later.
The five performance metrics you need
Sortino = (R − Rf) / downside volatility
Calmar = CAGR / max drawdown
strategy max DD − benchmark max DD
Win rate = periods ahead / all periods
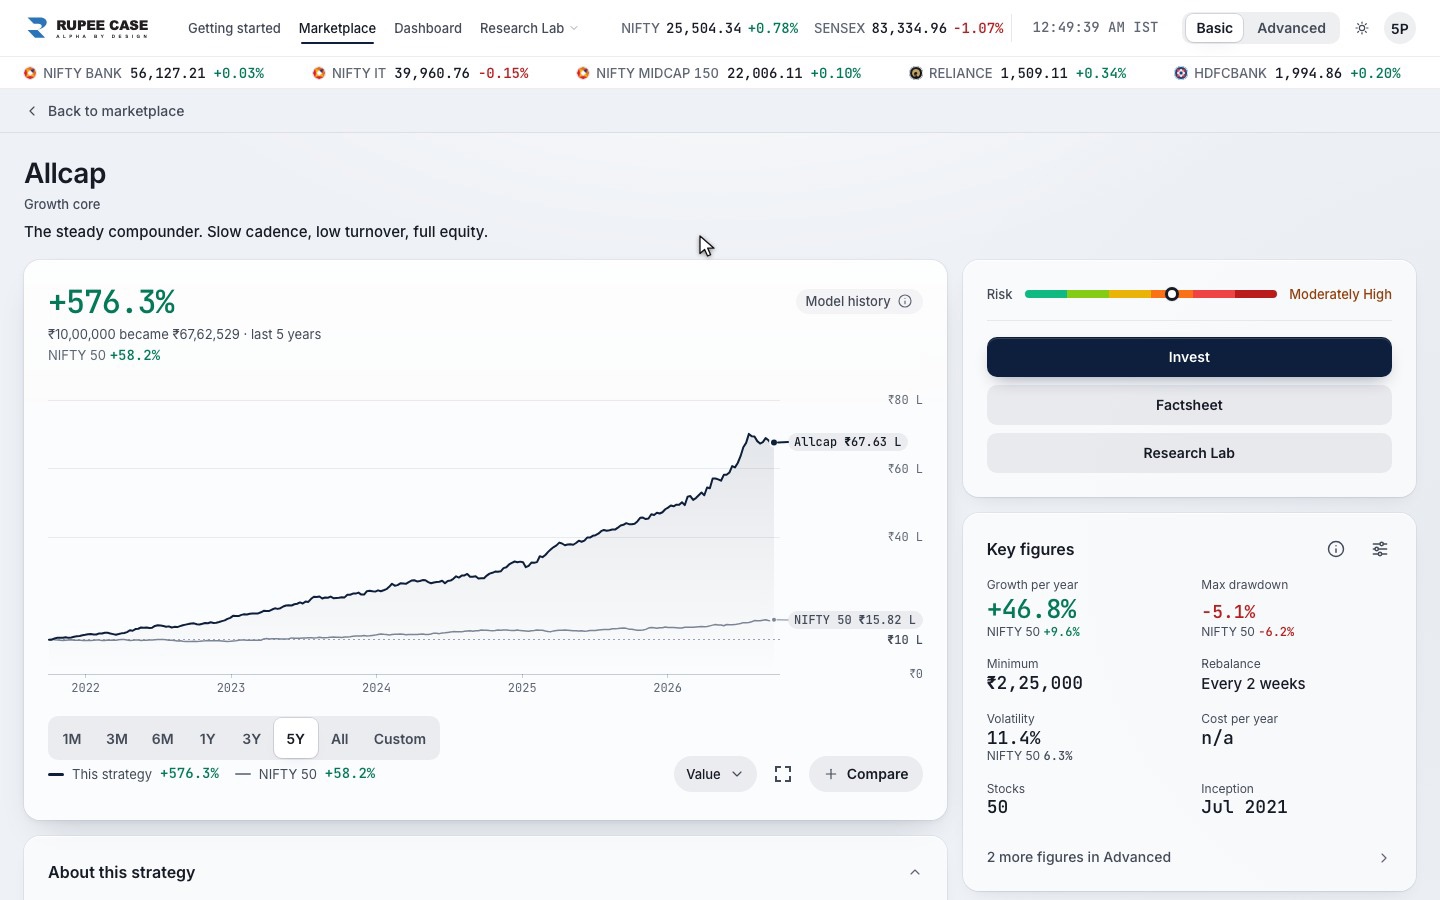
The Allcap model grew from 100 to about 610 between July 2021 and July 2026; the Nifty 50 TRI line, drawn as a smoothed CAGR line, to about 160.
Worked example: reading a real factsheet
Let me apply all five to a factsheet on this site, the Allcap strategy, the way I would read anyone else's. Every figure is model, back tested, after charges, from the factsheet and the strategy lineup as of 27 Apr 2026.
| Metric | Allcap, model | Nifty 50 | What it tells you |
|---|---|---|---|
| CAGR | 44.7% | 9.8% (TRI) | Large excess return, over a 5 year window |
| Sharpe | 1.68 | 0.69 | Much more return per unit of volatility |
| Calmar | 1.96 | 0.54 | Paid well for the worst fall |
| Volatility | 23.58% | 14.15% | A much bumpier ride |
| Max drawdown | −22.72% | −16.92% | Fell about 6 points further than the index |
| Weeks up | 62.07% | 56.32% | A healthy, not magical, hit rate |
| Worst 1 year window | −4.2% | Calendar 2025 was −4.2% |
Model, back tested, after charges. Risk figures are weekly over the rolling 5 years to 13 Jul 2026; CAGR and Sharpe from the lineup as of 27 Apr 2026. Not a promise of future returns.
Now the sceptic's questions. First, the benchmark. The factsheet compares with the Nifty 50, but Allcap buys from the whole Nifty Total Market, which includes smaller companies. The fairer check is a broad index TRI, and I would expect the gap to be smaller against it. Second, the window. The back test starts in July 2021, a period that includes a strong run for Indian mid and small caps. Five years is the minimum I accept, and it is still one market regime. Third, the drawdown: 6 points deeper than the Nifty 50 and 476 days to recover. If you could not sit through that, the CAGR is irrelevant to you.
I publish these numbers precisely so readers can ask these questions. A good strategy survives the questions. A story does not.
Separating skill from market
The simplest attribution splits a return into the part that came from market exposure and the part that did not:
Numbers: a strategy returns 28% in a year when the Nifty 500 TRI returns 20% and the risk free rate is 6.5%. Its beta is 1.2. The market explains 6.5 + 1.2 × (20 − 6.5) = 22.7%. Alpha is 28 − 22.7 = 5.3 points, not the 8 points the headline gap suggests. In a falling year the same beta works against you, which is why high beta strategies look brilliant in bull markets and ordinary over a full cycle.
How long before you can evaluate a strategy?
This is the most important and most ignored question. Short periods are dominated by luck, not skill.
| Evaluation period | Confidence in results | Why |
|---|---|---|
| 1 month | Near zero | Monthly returns are almost pure noise. Random portfolios show one month alpha all the time. |
| 1 year | Very low | One year is dominated by the market regime. Anything can look good or bad in 12 months. |
| 3 years | Moderate | Patterns start to show, but it may not include a full market cycle. |
| 5 years | Meaningful | Usually includes at least one significant correction. |
| 10 years or more | High | Several cycles. Alpha that survives this long is more likely real. |
For context: as of 9 Oct 2026 the Nifty 50 was down 10.57% over one year and 14.5% below its 2 Jan 2026 record close (NSE daily data). Any strategy judged on that single year alone would be judged mostly on the market, not on its rule.
The practical implication: do not change a strategy because of six or twelve months of underperformance. With a healthy win rate of 55 to 65% of months, you should expect to trail the benchmark in 35 to 45% of months. Six bad months in a row are well within normal. Judging a strategy every three to five years is not laziness. It is statistics.
MythThe strategy with the highest CAGR is the best one.
FactCAGR without the benchmark, the window, the costs and the worst fall says little. A high return bought with a drawdown you could not hold is worth nothing to you.
Common mistake: the flattering comparison
The most common mistake is accepting the comparison you are shown. A mid cap fund against the Nifty 50 price index. A three year window that starts at a market low. Returns before fees, or before tax. Each choice adds a few points of apparent skill, and together they can turn an average result into a star.
The fix is a one line rule. Before you congratulate any strategy, find the right TRI for the same universe over the exact same window, after every cost, and compare. If it does not beat the index after fees, it is not a strategy. It is a story. I hold the factsheets on this site to that rule, and you should too.
How this shows up in RupeeCase
Every strategy factsheet shows calendar year returns, monthly returns, rolling 1 year and 3 year returns, the deepest falls with days to recover, and a risk table with Sharpe, Sortino, Calmar, volatility, best and worst week and weeks up, next to the Nifty 50. Charts draw the Nifty 50 TRI as a CAGR line. All return figures are model, back tested, after brokerage, STT, exchange charges and GST, over a rolling 5 year window. Read them with the questions above. The track record page brings every model curve and every graded podcast call together, and compare lines any two strategies up.
Questions readers ask
What is a good Sharpe ratio for an Indian equity strategy?
Broad indices have usually shown Sharpe ratios below 1 over long periods; the Nifty 50 showed 0.69 over the Allcap factsheet's window. Above 1 over five years or more is strong. Very high figures over short windows usually mean the window was kind, not that the strategy is extraordinary.
Why do mutual fund factsheets show TRI benchmarks?
Because SEBI requires it. Since 1 February 2018 scheme performance must be compared with the Total Return variant of the benchmark, so that dividends do not create a false gap between the fund and its index.
Is a back test the same as a track record?
No. A back test applies a rule to past data; a live record shows what happened after the rule was fixed. Read back tested figures as evidence that a rule was coherent in the past, never as a promise. Module 5.5 covers out of sample testing in detail.