

Factors..6 min read
The turnover tax on a factor
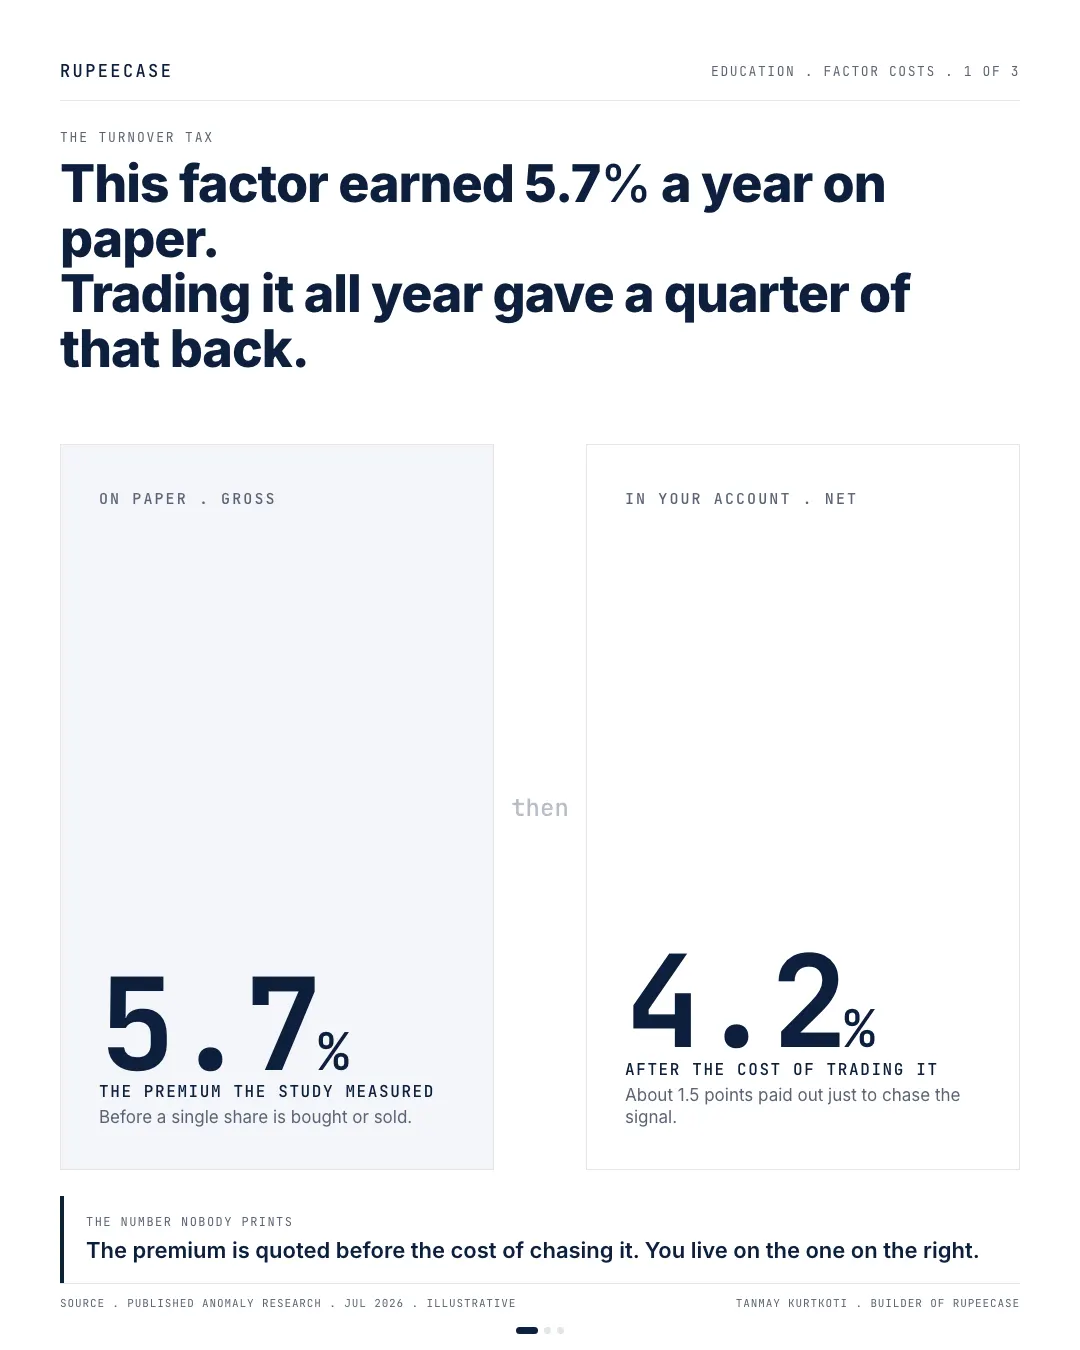
A 5.7 percent gross premium became 4.2 after trading costs, and factors traded slower than about half the book a month tend to keep a net edge.
By Tanmay Kurtkoti, founder of QC Alpha and builder of RupeeCase
Pulled a factor study last week and did the boring thing. I read the footnote.
The headline premium was 5.7 percent a year over the market. Nice number. Then a line further down the page: after the cost of actually trading the strategy, closer to 4.2. About a quarter of the edge was gone before it reached a single real account.
Here is the part most pitches skip. That give-back is not a one off. It is turnover, and turnover is a bill you pay whether the factor works or not.
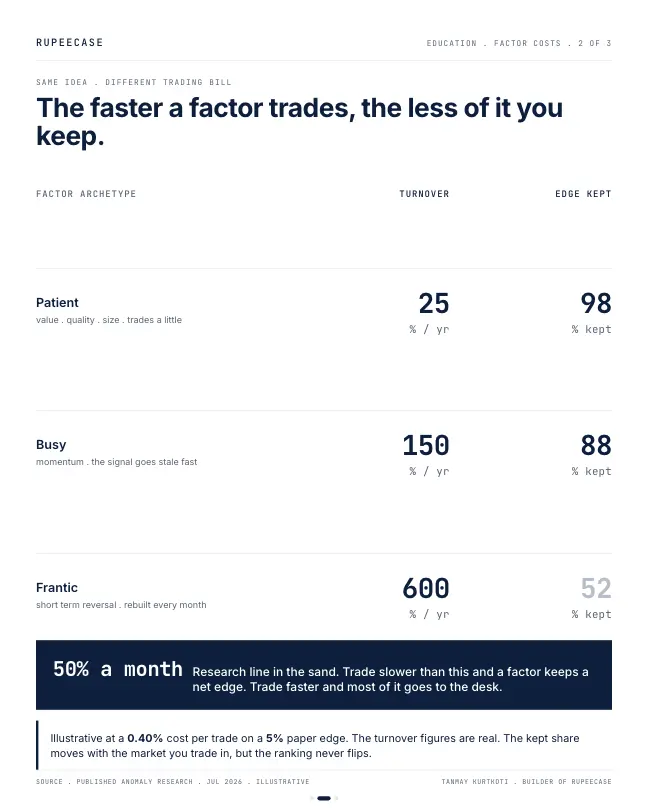
A patient rule, the kind built on value or quality, trades maybe a quarter of itself in a year. It keeps almost all of its edge. A momentum rule turns over one and a half times a year, so more of the premium leaks out to spreads and market impact. Same underlying idea. Very different bill at the end of it.
The research even draws a line. Trade slower than roughly half the book a month and a factor tends to keep a net edge. Trade faster and most of it disappears into the cost of chasing the signal. Short term reversal, rebuilt every single month, looks gorgeous on paper and is basically gone once you pay to trade it.
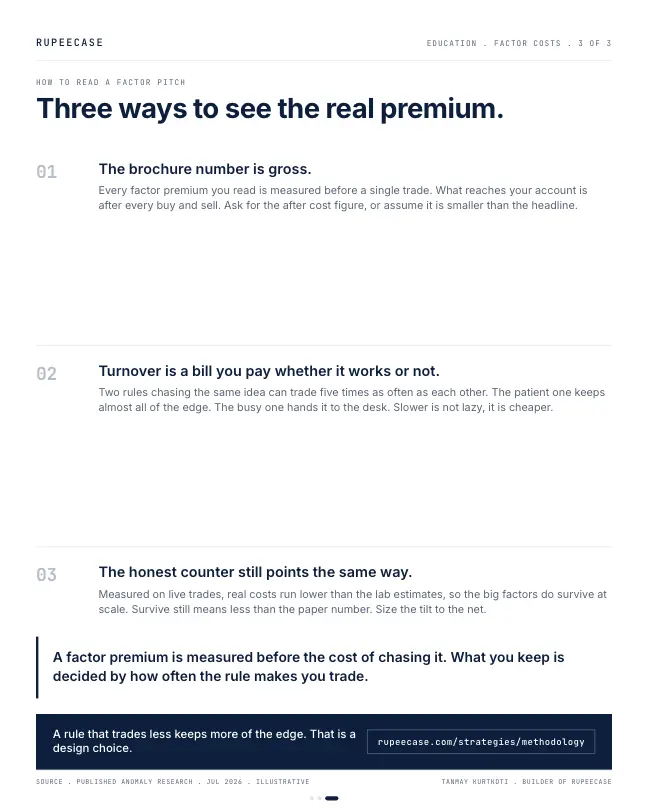
Honest counter, because it matters. Measured on live trades, real costs run lower than the scariest academic estimates, so the big factors do survive at scale. But survive still means less than the number on the brochure.
So two habits. Read the net premium, not the gross one on the slide. And treat low turnover as a feature, not a sign the manager is asleep. A rule that keeps more of the edge simply because it trades less is not lazy. That is a design choice
What one round trip costs in India
The study in the opening was about spreads and market impact. In India there is a second layer that no one can trade around: the statutory charges on every delivery trade. Here is one round trip, Rs 1,00,000 bought and later sold, at the rates in force in Oct 2026.
- STT, buy and sellRs 200
- Stamp duty, buy sideRs 15
- NSE transaction chargeRs 6.14
- SEBI turnover feeRs 0.20
Rs 1,00,000 delivery round trip. STT 0.1% each side; stamp duty 0.015% on the buy (since 1 Jul 2020); NSE 0.00307% each side incl. IPFT (from 1 Mar 2026); SEBI Rs 10 per crore each side. Before brokerage, GST and depository charges.
Add it up: Rs 200 + Rs 15 + Rs 6.14 + Rs 0.20 = Rs 221.34, or about 0.22 percent of the amount traded. That is before a single paisa of slippage. Slippage is the gap between the price you saw and the price you got, and it grows as you move down the size ladder. For the worked example I will assume 0.20 percent each side, 0.40 percent a round trip. Treat that as an illustration, not a measured figure: in the most liquid large caps it can be smaller, in thin small caps much larger.
So every full round trip costs about 0.22 + 0.40 = 0.62 percent.
Turnover turns that into a yearly bill
Turnover is how much of the portfolio gets sold and replaced in a year. A rule with 25 percent turnover replaces a quarter of its holdings. A rule with 150 percent turnover replaces the whole book one and a half times.
Take Rs 10,00,000 and run the three rules from the opening through the same 0.62 percent:
- Patient rule, 25 percent a year: Rs 2,50,000 traded both ways, cost about Rs 1,550, or 0.16 percent a year.
- Momentum rule, 150 percent a year: Rs 15,00,000 traded, cost about Rs 9,300, or 0.93 percent a year.
- Monthly reversal, the whole book every month: 1,200 percent, Rs 1.2 crore traded, cost about Rs 74,600, or 7.5 percent a year.
a year at 25 percent turnover
Worked example, 0.62% a round trip
a year at 150 percent turnover
Worked example, 0.62% a round trip
a year rebuilding the book monthly
Worked example, 0.62% a round trip
Now look back at the footnote. A 1.5 point give-back, 5.7 down to 4.2, is what about 2.4 round trips a year cost at 0.62 percent each. That is a momentum style turnover. And the reversal strategy's 7.5 percent yearly bill is larger than most factor premiums ever were, which is why it "looks gorgeous on paper and is basically gone".
The full trade cost calculator does the same for a single order, line by line: trade cost calculator.
The other turnover tax is the actual tax
High turnover has a second bill, and in India it is often bigger than the first. Sell within 12 months and a listed equity gain is short term. Hold past 12 months and it is long term. Since 23 Jul 2024 the short term rate is 20 percent, and long term gains are taxed at 12.5 percent above Rs 1.25 lakh a year.
Rs 1,50,000 gain, short term
- Taxed at 20 percent
- Tax: Rs 30,000
- Kept: Rs 1,20,000
Same gain, long term
- First Rs 1,25,000 of the year's long term gains exempt
- 12.5 percent on Rs 25,000: Rs 3,125
- Kept: Rs 1,46,875
Same portfolio, same gain, a Rs 26,875 difference, and it comes from nothing but the holding period. A rule that rebuilds itself every few weeks realises almost every gain as short term. A rule that turns over a quarter of the book a year leaves most gains to age. None of this says a fast rule is wrong. It says the brochure's gross premium has to clear both bills before it means anything to you.
Reading a strategy with turnover in mind
When I look at any rule now, ours included, I walk the premium down to what reaches the account:
- Gross premiumThe number on the slide, before any trading.
- Statutory chargesAbout 0.22 percent a round trip, times turnover.
- SlippageSpread and impact, bigger in thin stocks and fast rules.
- Tax20 percent on gains realised inside a year, 12.5 percent after.
- Net premiumThe only figure worth comparing.
A momentum rule can still be worth running after all four steps. A monthly reversal rule usually is not.
The free Learn module on trading costs walks through the full Indian cost stack, NSE's impact cost data and how backtest returns shrink on the way to a live account: The Real Cost of Trading. Two related posts go further: the factor zoo on why most published factors fail after costs, and factor crowding and decay on what happens to an edge once everyone trades it.
Questions readers ask
How much does it cost to buy and sell Rs 1 lakh of shares in India?
The statutory charges on a delivery round trip come to about Rs 221 at Oct 2026 rates: Rs 200 of STT, Rs 15 of stamp duty, about Rs 6 of NSE transaction charges and 20 paise of SEBI fee. Brokerage, GST and depository charges come on top, and so does slippage, which depends on the stock's liquidity.
What is portfolio turnover and why does it matter?
Turnover is the share of a portfolio sold and replaced in a year. Every round trip pays STT, stamp duty, exchange charges and slippage, so cost scales with turnover: at about 0.62 percent a round trip, 25 percent turnover costs about 0.16 percent a year and 150 percent costs about 0.93 percent.
Is short term capital gains tax higher than long term on shares?
Yes. Since 23 Jul 2024, gains on listed shares sold within 12 months are taxed at 20 percent, and gains on shares held longer are taxed at 12.5 percent above Rs 1.25 lakh a year. On a Rs 1,50,000 gain that is Rs 30,000 against Rs 3,125, before surcharge and cess.
The cards
3 cards. Swipe, or tap to open.
Explore next
Learn it properly, then see it applied.
- GuideMutual fund vs direct stocks: how the tax really differsSame rates, different timing: turnover, dividends and losses, worked in rupees.
- Free module 2.2Introduction to Factors10 min read
- StrategyAllcap strategyNifty Total Market, 50 stocks, every 2 weeks
- CalculatorFee drag over 20 yearsFree, with the formula and a worked example
Related
- The factor zooHou, Xue and Zhang rebuilt 452 published factors and found 65 percent failed a basic test and 82 percent failed an honest one.Factors . . 5 min
- The edge decays when you read about itMcLean and Pontiff measured 26 percent decay out of sample and 58 percent after publication, which stretches a 0.60 Sharpe's proof time from 11 years to 59.Factors . . 13 min
- Factor crowding and decayMcLean and Pontiff found the median published anomaly kept 42 percent of its in sample alpha, which is why a brochure backtest and a live fund can sit nine points apart.Factors . . 5 min
Educational content only. Figures are illustrative and computed on historical or representative data for teaching purposes, not investment advice. Past performance does not guarantee future returns. Sourced from NSE, BSE, SEBI, AMFI and RBI public data.