

Factors..5 min read
Size: a regime, not a rule
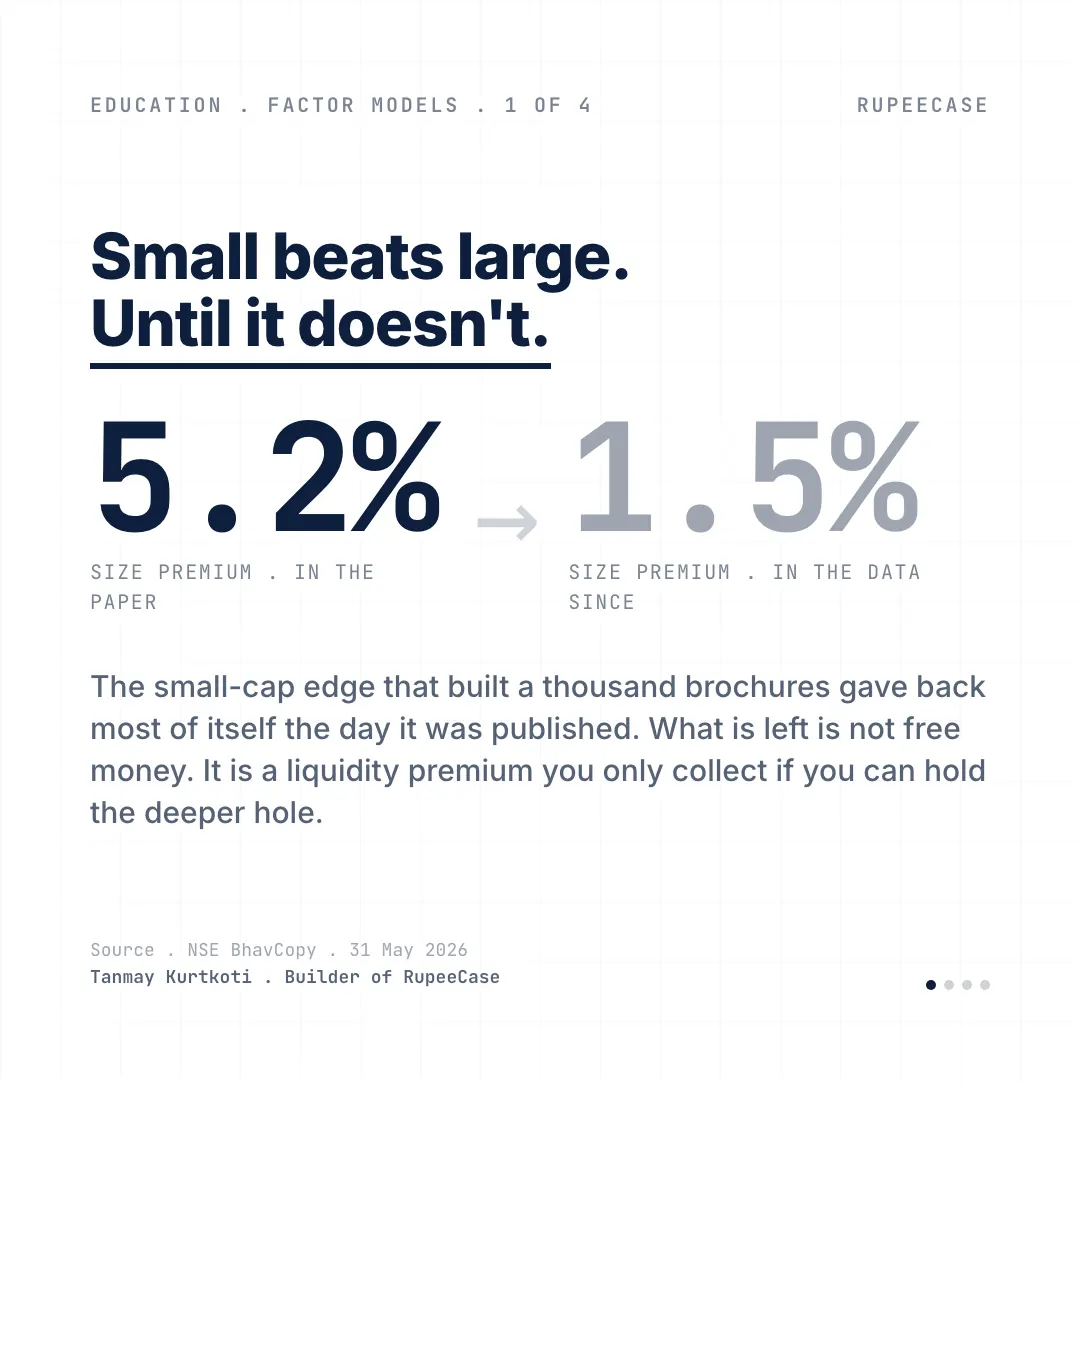
Banz's 5.2 percent size premium has decayed about 71 percent since publication, and on RupeeCase's own cap curve the return barely moves while the drawdown deepens.
Model, back tested, as of 27 Apr 2026, as published then; the strategy page shows the current figure.
By Tanmay Kurtkoti, founder of QC Alpha and builder of RupeeCase
A friend forwarded me a small-cap fund chart on Sunday morning. Five years, straight up and to the right. His question was simple: if small beats large, why isn't my whole SIP sitting in small caps?
It is a fair question. The answer is the part the brochure quietly skips.
Small beats large is real, in the textbook. Banz documented the size premium in 1981 at roughly 5.2 pct a year. It built a thousand fund factsheets. Then the paper got read, the money came in, and the edge did what crowded edges do. Out of sample since, the premium reads closer to 1.5 pct. Around 71 pct of it has decayed.
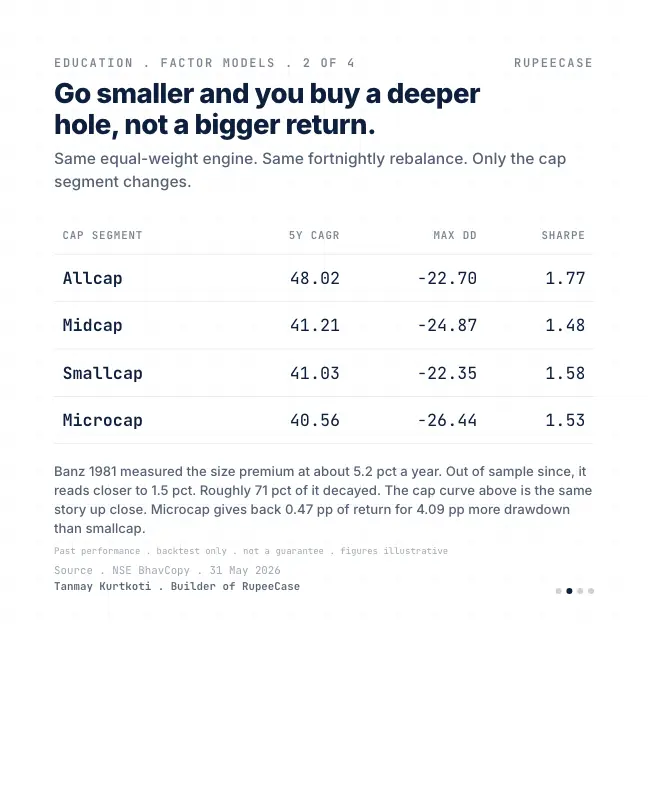
You can see the same thing up close without any academic paper. Take the same equal-weight engine and the same fortnightly rebalance, change only the cap segment, and the cap curve flattens fast. Allcap 48.02 pct CAGR. Midcap 41.21. Smallcap 41.03. Microcap 40.56. The return barely moves as you go smaller. The drawdown keeps deepening, from minus 22.7 pct down to minus 26.4 pct. Microcap gives back almost half a point of return for four points more pain. (Backtest, illustrative, not a guarantee.)
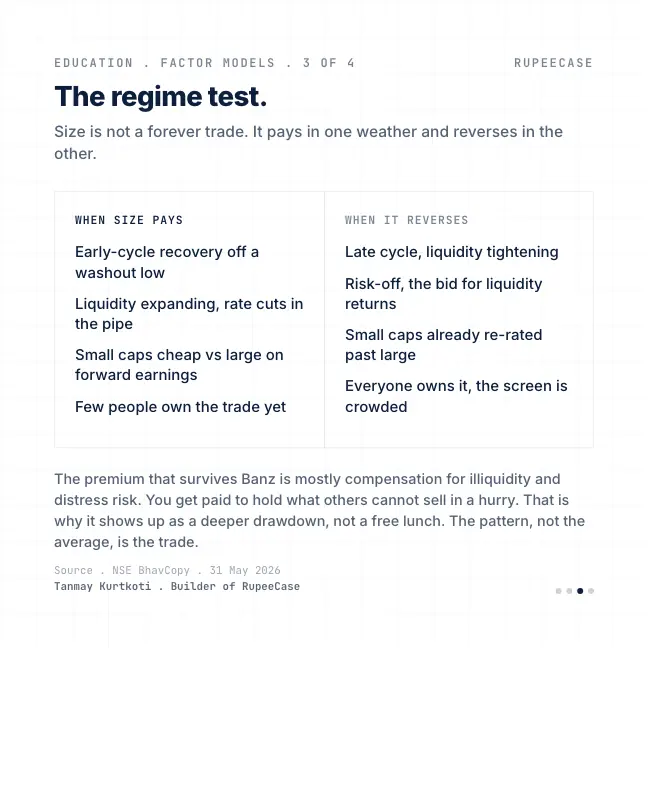
Here is the part that matters. The premium that survived is not a reward for being clever. It is compensation for illiquidity and distress risk. You get paid to hold what other people cannot sell in a hurry. So it pays in one kind of weather and reverses in the other. Early cycle, liquidity loosening, small caps cheap and uncrowded, it works. Late cycle, risk-off, everyone already in, it hands the book back.
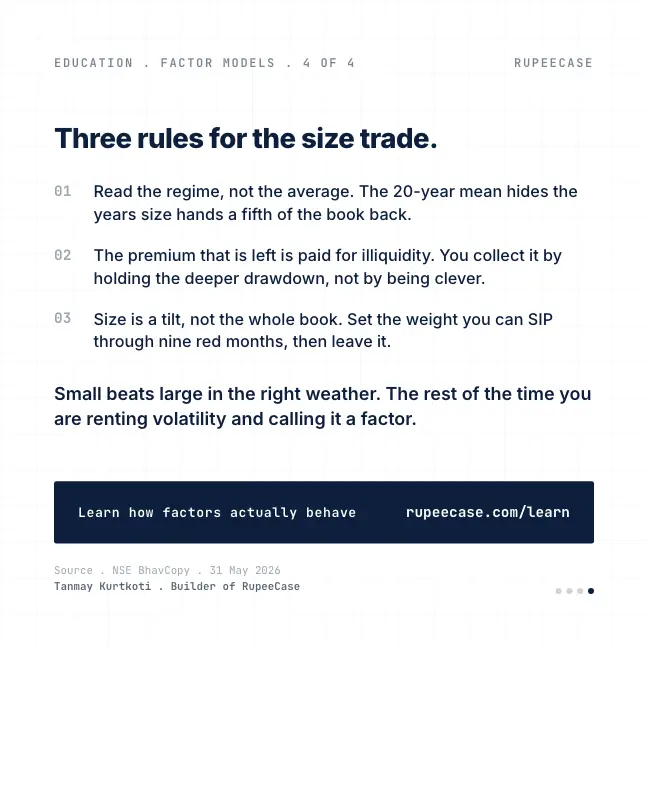
So size is a tilt, not the whole portfolio. Read the regime, not the twenty-year average. Pick a weight you can SIP through nine straight red months, then stop touching it.
Small beats large in the right weather. The rest of the time you are renting volatility and calling it a factor.
The cap curve, updated
The figures in the opening were the ones published in May. Here is the same cap curve from the current lineup file. The shape held: going smaller did not add return, and it did not reduce the worst fall. Allcap shows a 44.70 percent CAGR with a worst fall of 22.72 percent, Midcap 38.75 percent and 24.87 percent, Smallcap 37.40 percent and 22.34 percent, Microcap 37.33 percent and 26.43 percent (Model, back tested, as of 27 Apr 2026).
On the model figures, Allcap compounded at 44.70 percent, Midcap at 38.75, Smallcap at 37.40 and Microcap at 37.33 percent a year to 27 Apr 2026.
All four rank on momentum inside their own NSE universe and rotate every two weeks. So the comparison isolates one thing, the size of the companies, and on this window size alone paid nothing extra.
What NSE's size indices did in the last two years
The real indices tell the regime story directly. From 9 Oct 2024 to 9 Oct 2026, the Nifty Microcap 250 ended 1.34 percent higher on price while the Nifty 50 ended 9.85 percent lower. Smaller won on the destination. Look at the bracketed falls along the way, though: the deeper the universe, the deeper the hole.
- Microcap 250 (fell 28.5%)1.34%
- Midcap 150 (fell 19.8%)-1.44%
- Smallcap 250 (fell 25.7%)-2.92%
- Nifty 500 (fell 16.2%)-7.34%
- Nifty 50 (fell 15.6%)-9.85%
Price return, 9 Oct 2024 to 9 Oct 2026, deepest fall from a high in brackets. NSE index closes.
The swings tell the same story. Over those two years the Nifty Microcap 250 moved with 21.3 percent annual volatility, the Smallcap 250 with 18.9 percent and the Nifty 50 with 13.2 percent. And the long view is harsher still: the Smallcap 250 lost more than half its value between January 2018 and March 2020, and buyers near the 2018 top waited years to get back.
The weather report: what you pay today
The opening says the premium pays when small caps are cheap and uncrowded. On 9 Oct 2026 NSE showed the Smallcap 250 at 34.0 times earnings and the Midcap 150 at 28.1, against 19.3 for the Nifty 50. That is not the cheap and uncrowded weather. A premium earned from a high starting price has less room to run.
P/E of the Nifty Smallcap 250
NSE, 9 Oct 2026
P/E of the Nifty Midcap 150
NSE, 9 Oct 2026
P/E of the Nifty 50
NSE, 9 Oct 2026
The illiquidity you are paid for, in rupees
Compensation for illiquidity sounds abstract until you place an order. Say a small company's shares trade Rs 40 lakh a day on average. A Rs 2 lakh order is 5 percent of a normal day: you nudge the price, but you get in. A Rs 20 lakh order is half the day's trade, and you push the price against yourself going in and again coming out. That cost never shows on a chart of the index.
MythSmall caps always beat large caps over the long run.
FactThey pay in some regimes and give it back in others. The Smallcap 250 lost more than half its value from Jan 2018 to Mar 2020, and on RupeeCase's model figures going smaller added no return.
The free Learn module on the size factor covers the NSE size ladder, liquidity and how to size a small cap sleeve, with a quiz. The posts on size against junk and factor crowding take the decay argument from the opening further.
Questions readers ask
What is the size factor?
It is the tendency of smaller companies to earn higher returns than larger ones over long periods, as payment for lower liquidity and higher risk of distress. The premium has been uneven and much smaller since it became widely known, and it reverses for long stretches.
Are small caps riskier than large caps in India?
On NSE data, yes. In the two years to 9 Oct 2026 the Nifty Smallcap 250 fell 25.7 percent at its worst and the Microcap 250 28.5 percent, against 15.6 percent for the Nifty 50, with volatility of 18.9 and 21.3 percent against 13.2.
How much of a portfolio can sit in small caps?
That depends on how deep a fall you can hold through without selling. Small cap indices have fallen 25 percent in recent years and more than 50 percent from 2018 to 2020, so the usual approach is a fixed weight, chosen in advance and rebalanced on a schedule, rather than one that grows after a good run.
The cards
4 cards. Swipe, or tap to open.
Explore next
Learn it properly, then see it applied.
Related
- Size matters, if you control your junkSmall beats large among quality stocks and among junk stocks, yet the blended small cap average trails because most small caps are junk.Factors . . 4 min
- The size myth on our own shelfMidcap, Smallcap and Microcap printed 41.21, 41.03 and 40.56 percent while the Allcap basket did 48.02 with a similar worst drop, so small on its own is not an edge.Factors . . 5 min
- Factor crowding and decayMcLean and Pontiff found the median published anomaly kept 42 percent of its in sample alpha, which is why a brochure backtest and a live fund can sit nine points apart.Factors . . 5 min
Educational content only. Figures are illustrative and computed on historical or representative data for teaching purposes, not investment advice. Past performance does not guarantee future returns. Sourced from NSE, BSE, SEBI, AMFI and RBI public data.