

Costs: MF, PMS, RupeeCase..6 min read
Recipe versus paragraph: reading a methodology page
Universe, entry rule, weight method and cadence decide whether a strategy is a process or a paragraph, and a conviction weighted PMS brochure answers none of them.
By Tanmay Kurtkoti, founder of QC Alpha and builder of RupeeCase
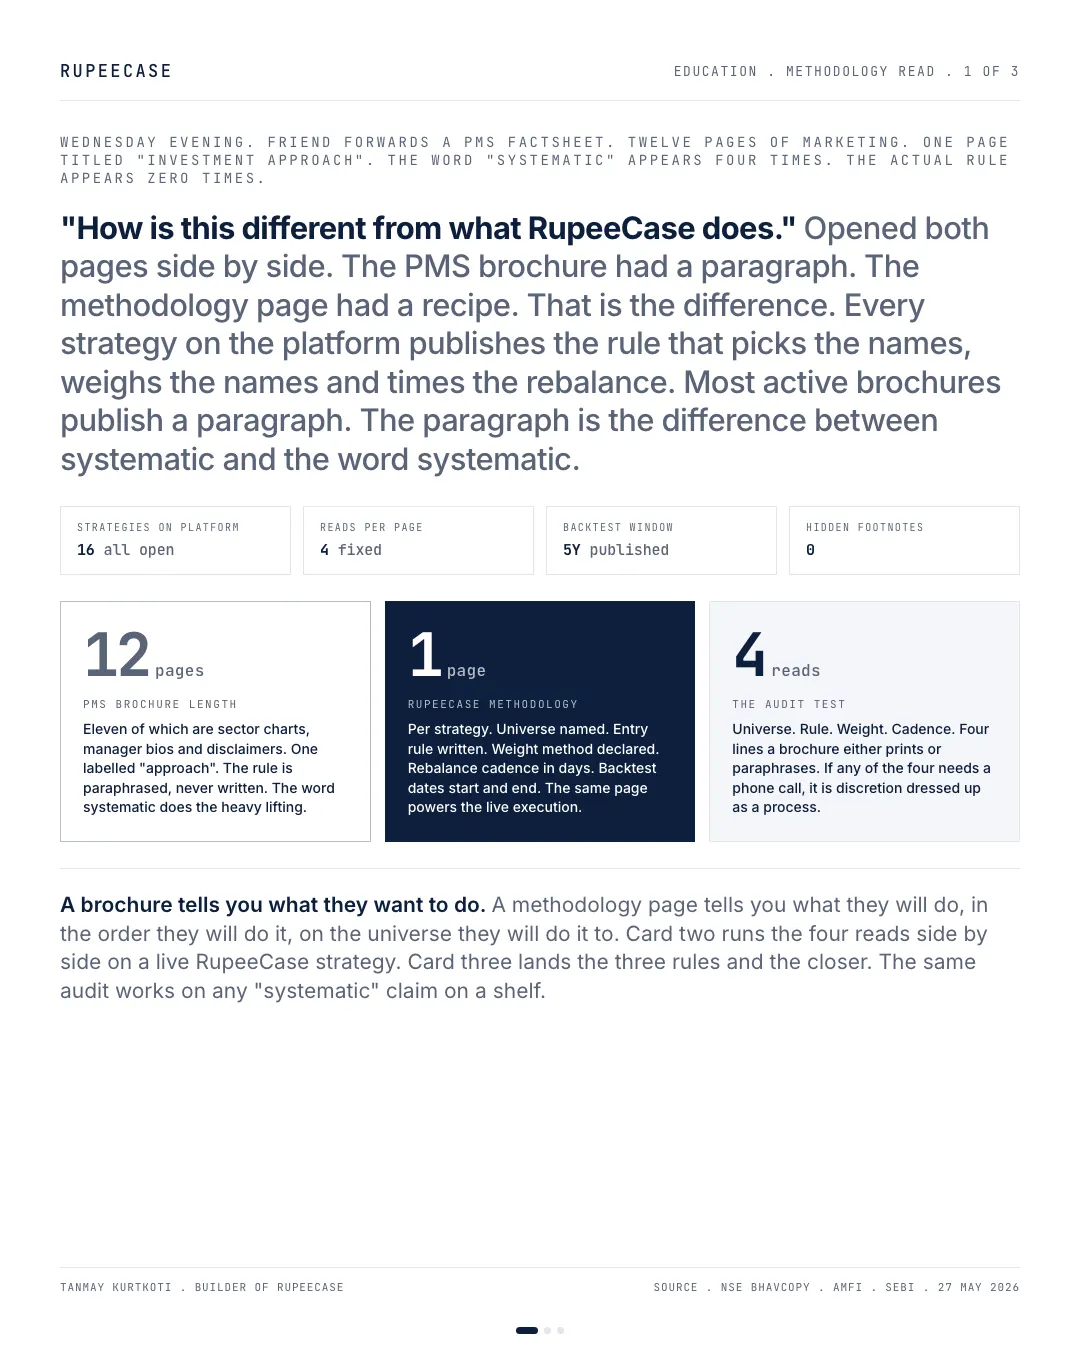
Friend forwards a PMS factsheet on Wednesday evening. Twelve pages of marketing. One page titled "Investment Approach". The word "systematic" appears four times. The actual rule appears zero times.
"How is this different from what RupeeCase does."
Opened both side by side. The PMS brochure had a paragraph. The methodology page had a recipe. That is the whole difference.
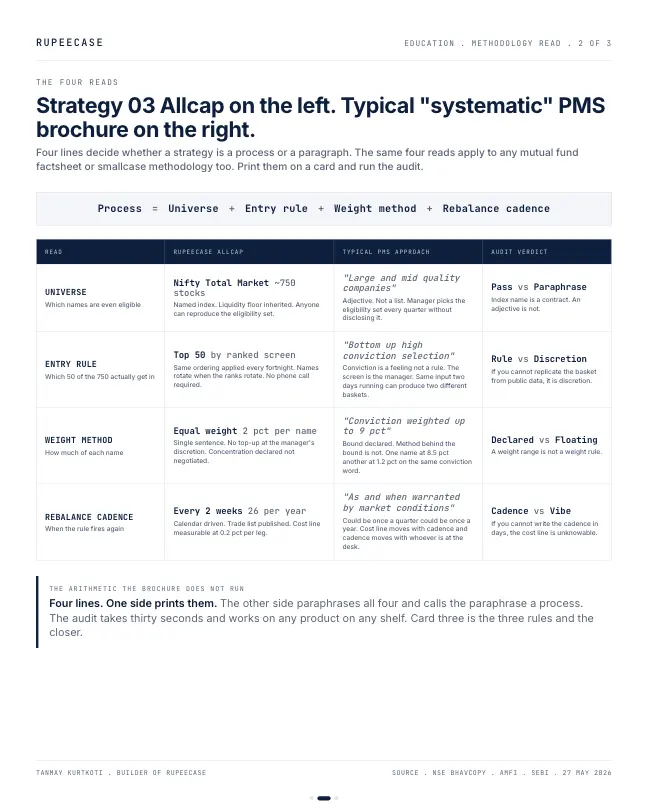
Four reads decide whether a strategy is a process or a paragraph.
Universe. Which names are even eligible. RupeeCase Allcap says Nifty Total Market, roughly 750 stocks, named index, liquidity floor inherited. Typical PMS approach says "large and mid quality companies". One is a contract. The other is an adjective.
Entry rule. Which fifty of the 750 get in. RupeeCase says top 50 by a ranked screen applied on the same close every fortnight. PMS says "bottom up high conviction selection". Conviction is a feeling, not a rule. Two people reading the same brochure end up with two different baskets.
Weight method. How much of each name. RupeeCase says equal weight, two pct per name, declared. PMS says "conviction weighted up to nine pct per name". A bound is not a method. One name at 8.5 pct and another at 1.2 pct on the same conviction word.
Cadence. When the rule fires again. RupeeCase says every two weeks. Twenty six firings per year. Trade list published. Cost line measurable at 0.2 percent of traded value. PMS says "as and when warranted by market conditions". That could be four firings or one. Whoever is at the desk decides.
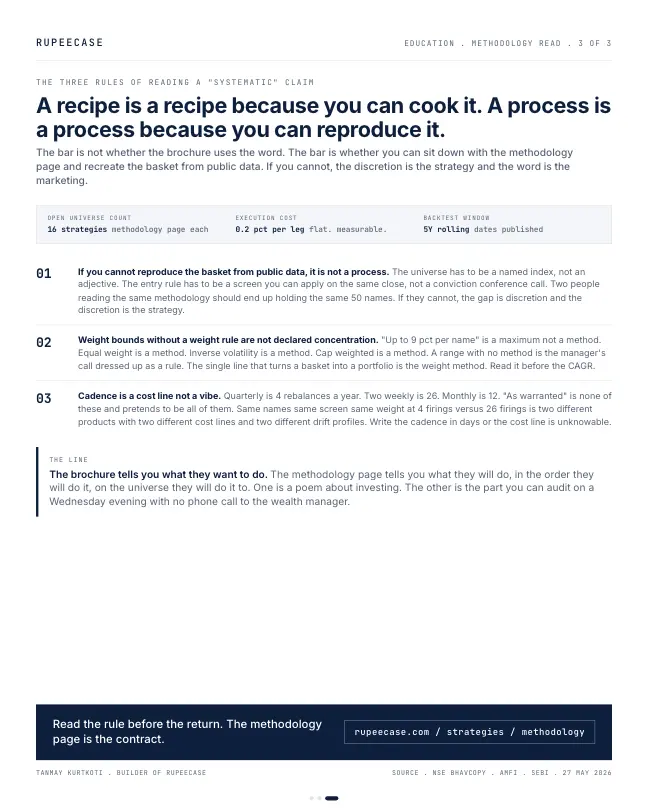
Three rules I keep coming back to. If you cannot reproduce the basket from public data, the discretion is the strategy. A weight bound is not a weight method. Cadence in days or the cost line is unknowable.
The brochure tells you what they want to do. The methodology page tells you what they will do, in the order they will do it, on the universe they will do it to. One is a poem. The other is a contract
The reproducibility test
Here is the test I apply to any strategy, ours included. Hand the methodology to two people who have never met. Give them the same public data and the same date. If they come back with the same basket, the strategy is a process. If they come back with different baskets, the strategy is whoever sits at the desk.
Two readers, two baskets
- Universe: "quality large and mid companies"
- Entry: "high conviction, bottom up"
- Weight: "up to 9 percent per name"
- Cadence: "as markets warrant"
Two readers, one basket
- Universe: a named NSE index, a price cap
- Entry: top 50 on a ranked screen
- Weight: equal, 2 percent each
- Cadence: every two weeks, on a fixed close
Each of the four reads closes a door that discretion could walk through. A named universe stops the manager from wandering into a stock that suits the story. A ranked entry stops him from keeping a favourite that fell down the list. A declared weight stops a "high conviction" idea from quietly becoming a fifth of the book. A fixed cadence stops trading from happening whenever the news is loud.
What a weight bound does to Rs 10 lakh
The weight read is the one people underrate, so put rupees on it. Rs 10 lakh in an equal weight basket of 50 names is Rs 20,000 per name. Under a bound of "up to 9 percent", the same Rs 10 lakh can hold Rs 85,000 in one name and Rs 12,000 in another, on the same conviction word.
Now let each of those names fall 30 percent in a bad result week.
of the book lost: equal weight name at 2 percent
Worked example, Rs 10 lakh
of the book lost: the same fall at 8.5 percent
Worked example, Rs 10 lakh
Rs 6,000 against Rs 25,500. Neither is wrong. But only one of them was knowable before the fall. With a weight method you can work out your worst single stock hit in advance. With a weight bound you find out afterwards.
Cadence makes the cost line measurable
The fourth read is where the money is. A strategy that trades on a fixed cadence can tell you roughly what trading costs, because the number of firings is known. Allcap fires 26 times a year. The rebalance record shows 135 rebalances from 14 May 2021 to 3 Jul 2026, an average gap of 14.0 days (Model, back tested rebalance record, as of 3 Jul 2026).
The cost line on the platform is 0.2 percent of traded value. So the yearly cost depends on how many names change at each firing. If 6 of the 50 names are replaced, 12 percent of the book is sold and 12 percent bought: 24 percent traded, 0.048 percent of the book in cost, about 1.25 percent a year over 26 firings. That turnover is an assumption for the worked example, not a published figure.
Try "as and when warranted" in that calculator. You cannot, because there is no number to type in the third box. That is the point of the third rule in the opening.
The back test also reports the cost directly. The Allcap factsheet's cost decomposition shows a gross return of 727.97 percent, an estimated cost of 106.12 percentage points, and a net return of 621.85 percent (Model, back tested, factsheet cost decomposition as of 13 Jul 2026). The headline figures are net of that: 44.70 percent CAGR with a maximum drawdown of 22.72 percent (Model, back tested, as of 27 Apr 2026, lineup.json).
Four questions to ask any methodology
- UniverseIs it a named list you could download today?
- EntryCould you rank the names yourself from public data?
- WeightIs it a method, or only a ceiling?
- CadenceIs it a number of days, and is the trade list published?
Four yes answers do not make a strategy good. A clear rule can still be a bad rule, and a back test can still flatter it. What four yes answers buy you is the ability to check. You can see what the strategy will do before it does it, and compare what it did with what it said.
The free Learn module on building your first systematic strategy walks through universe, signal, weights and cadence step by step, with a quiz. The rebalance cost calculator runs the cost line for your own cadence. For the strategy behind the recipe column, read the Allcap spotlight.
Questions readers ask
How do I know if a PMS or fund is really systematic?
Ask whether two people could rebuild the portfolio from the methodology and public data and get the same basket. A systematic process names its universe, its ranking rule, its weight method and its rebalance dates. If any of the four is an adjective, the outcome depends on a person.
What is the difference between a weight limit and a weight method?
A limit is a ceiling, such as "no stock above 9 percent". A method fixes the weight, such as "every stock at 2 percent". Under a limit, two stocks on the same conviction can sit at 8.5 and 1.2 percent, so a 30 percent fall costs either 2.55 or 0.36 percent of the book.
Why does rebalance frequency matter for costs?
Every rebalance sells and buys part of the portfolio and pays charges on the traded value. With a fixed cadence you can multiply firings by turnover by cost: 26 firings a year, 24 percent traded each time, at 0.2 percent of traded value, is about 1.25 percent a year.
The cards
3 cards. Swipe, or tap to open.
Explore next
Learn it properly, then see it applied.
- Free module 6.3Mutual Funds, Structure, Types and Hidden Costs8 min read
- CalculatorGoal plannerFree, with the formula and a worked example
- Free module 2.5Building Your First Systematic Strategy9 min read
- CalculatorRebalance cost at 0.2%Free, with the formula and a worked example
- StrategyAllcap strategyNifty Total Market, 50 stocks, every 2 weeks
- Blog topicCosts: MF, PMS, RupeeCase notes25 notes
Related
- Allcap: the number everyone quotes and nobody picksAllcap carried the highest Sharpe of the three momentum cards at 1.77, with the shallowest drawdown of the three, and still spent 469 days underwater.Strategy notes . . 5 min
- PMS 2 and 20: the rupee mathOn a Rs 25 lakh book earning 18 percent gross, a 2 and 20 PMS fee stack with GST and trading drag takes 4.08 points, and the ten year compounding gap is Rs 38 lakh.Costs: MF, PMS, RupeeCase . . 6 min
- The tax you pay for someone else's tradesA PMS realises gains in your name every year while a fund defers to exit, and on the same 14 percent gross over ten years the structure alone keeps five to twelve lakh more invested.Costs: MF, PMS, RupeeCase . . 6 min
Educational content only. Figures are illustrative and computed on historical or representative data for teaching purposes, not investment advice. Past performance does not guarantee future returns. Sourced from NSE, BSE, SEBI, AMFI and RBI public data.