

Portfolio construction..4 min read
Capacity, tolerance, need: the three risks
A questionnaire scored one risk and pointed at 90 percent equity; capacity eight years from retirement and a need of about 9 percent a year both pointed near 60.
By Tanmay Kurtkoti, founder of QC Alpha and builder of RupeeCase
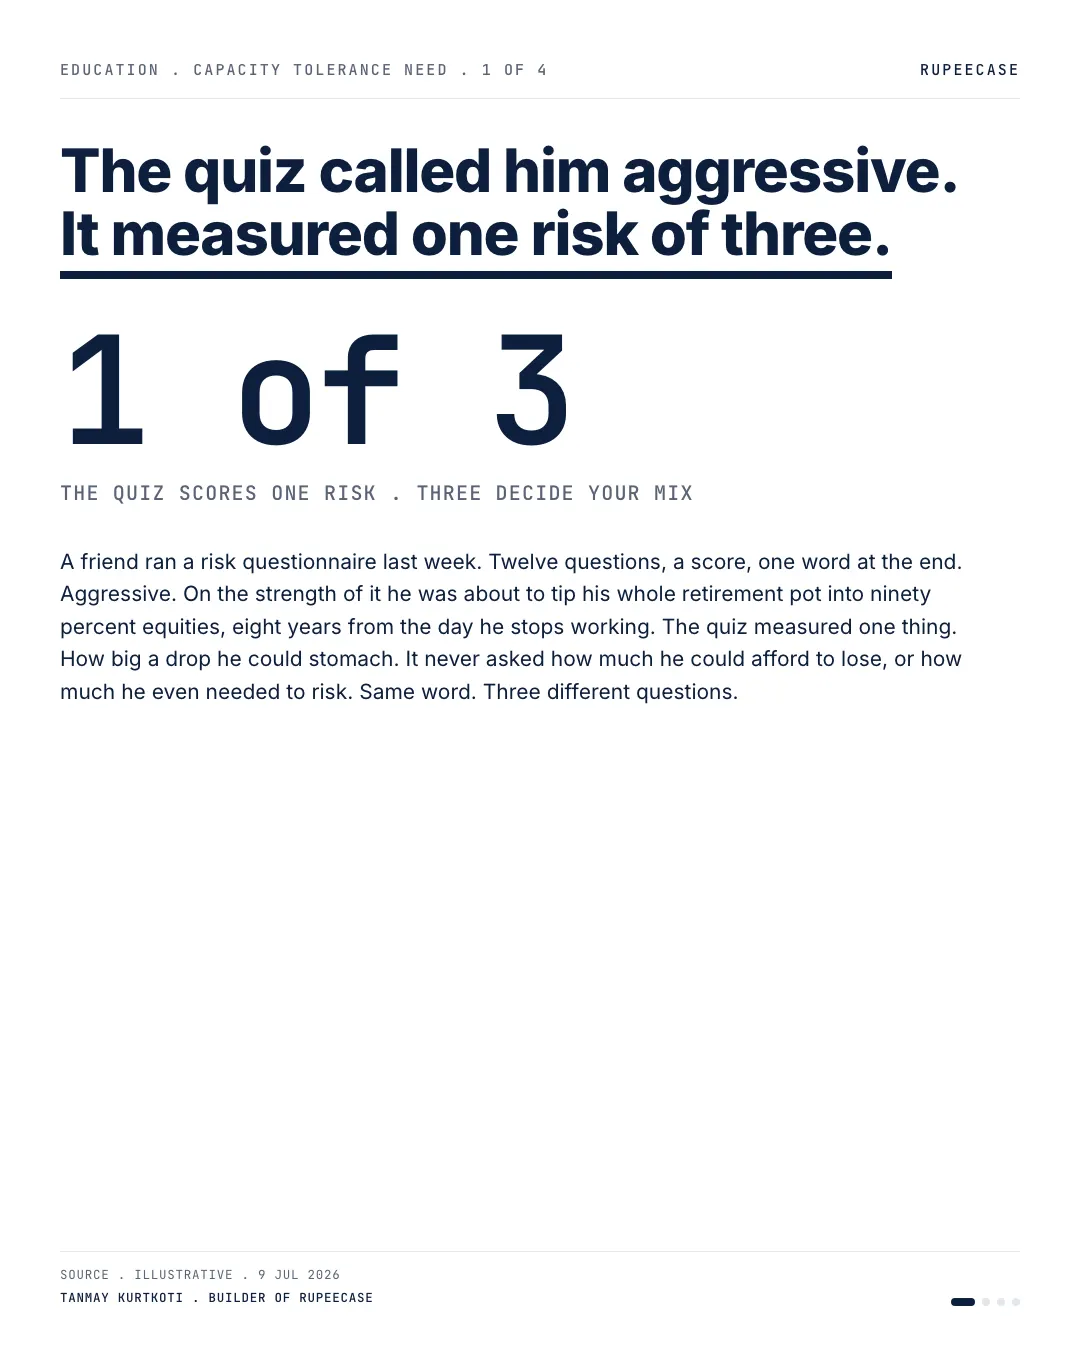
A friend ran one of those risk questionnaires last week. Twelve questions, a score, a single word at the end. Aggressive.
On the strength of that word he was about to tip his entire retirement pot into ninety percent equities. Eight years from the day he stops working.
Here is the part the quiz never told him. It measured one risk. His money answers to three.
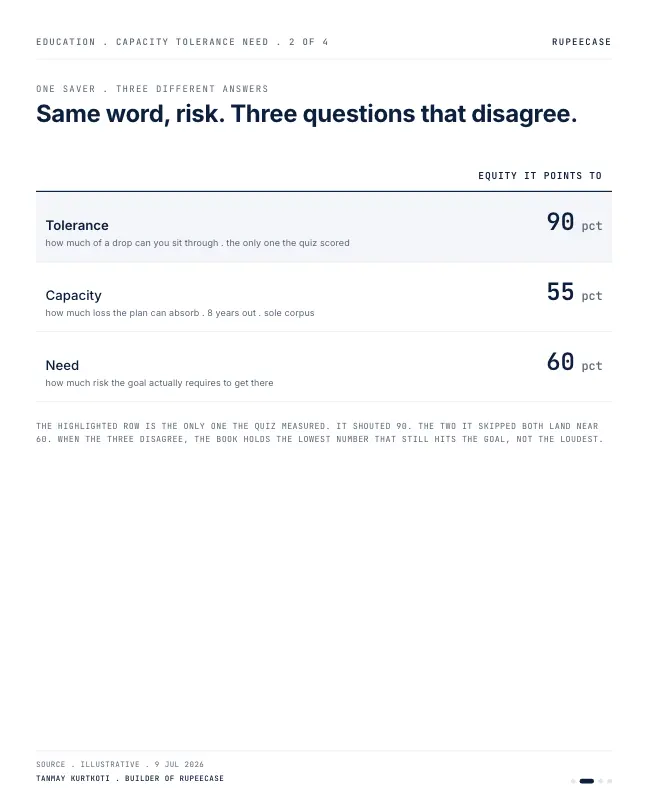
Tolerance is how much of a drop you can sit through without selling. That is the one the questionnaire scored, and for him it read ninety.
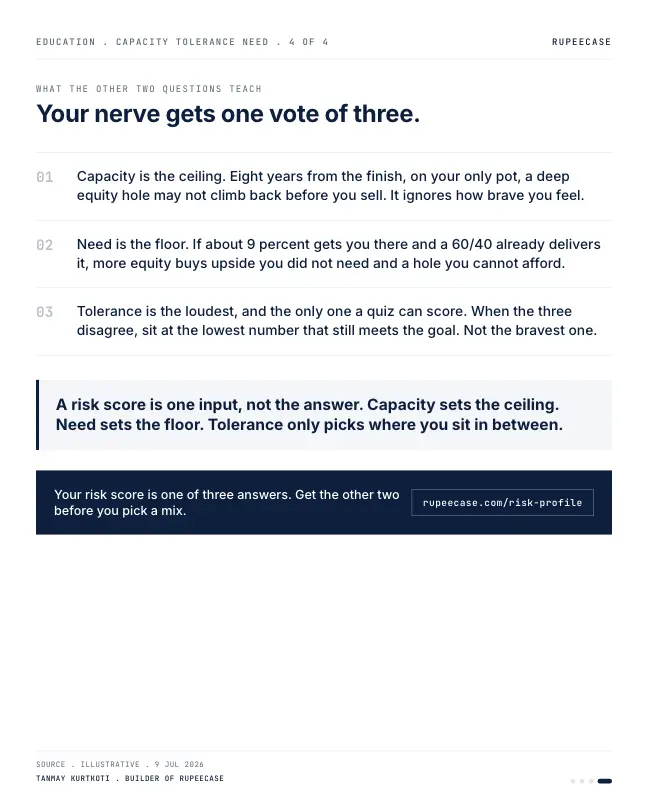
Capacity is a different question. It asks how much loss the plan can actually absorb. Eight years from the finish line, on the only corpus he has, a deep equity fall right before he starts withdrawing may not have time to climb back. Capacity does not care how brave he feels. It sets a ceiling.
Need is different again. It asks how much risk the goal even requires. Turning about sixty lakh into one point two crore in eight years needs roughly nine percent a year. A sixty forty mix already delivers that. So the extra equity was buying upside he did not need.
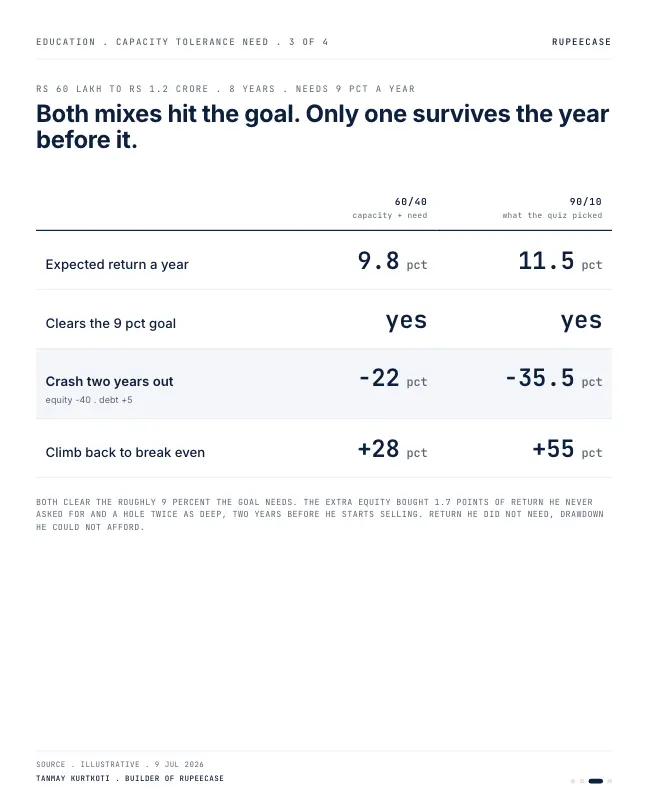
Put numbers on it and the two questions the quiz skipped both point near sixty percent equity, not ninety. The cost of ignoring them shows up in a single bad year. A crash two years before he retires is a twenty two percent hole at sixty forty. At ninety ten it is thirty five, and climbing back needs a fifty five percent bounce he does not have the runway for.
Capacity sets the ceiling. Need sets the floor. Tolerance only decides where you sit in between. A risk score is one input, not the answer. Answer all three before you pick the mix.
Need, worked out
The need number comes from one formula: the return required is the target divided by the start, raised to one over the years, minus one. Rs 60 lakh to Rs 1.2 crore in eight years is a doubling, and the eighth root of 2 is about 1.0905, so the need is about 9.05 percent a year.
Then ask what share of equity delivers that, given assumed returns for each sleeve. With equity at 12 percent and debt at 6.5, a mix with w in equity earns 6.5 plus w times 5.5. Setting that equal to 9.05 gives w of about 46 percent. That is the floor: less equity than that and the plan, on these assumptions, falls short.
Three answers on one line
When tolerance sits inside the band, it picks the spot. When it sits outside, as here, it is overruled. A brave investor with a near deadline lands at the ceiling. A nervous one with a modest goal lands at the floor.
A real bad quarter, at two mixes
The opening's crash numbers are an illustration. The last real test was recent. From 31 Dec 2025 to 30 Mar 2026 the Nifty 50 fell 14.54 percent and the Nifty Composite G-sec Index fell 1.44 percent, by NSE closing data. Apply that one quarter to his Rs 60 lakh.
- 60/40, a 9.30% fallRs -5.58 lakh
- 90/10, a 13.23% fallRs -7.94 lakh
Quarter 31 Dec 2025 to 30 Mar 2026, NSE closes: Nifty 50 26,129.60 to 22,331.40; Nifty Composite G-sec Index 3,052.91 to 3,009.05. Losses on Rs 60 lakh, RupeeCase calculation.
That was one quarter, and the index recovered part of it the next month. A deeper fall in the last two years before retirement is the case capacity is meant to guard against. The difference between the two mixes is not the return they promise. It is the loss they can deliver at the worst moment, when there is no salary left to keep buying.
The free Learn module on risk management covers risk budgets and drawdown limits in more depth, with a quiz and a certificate. The goal planner works out the return a goal needs from your own numbers. For what happens when one label is applied to several goals, read one profile, many goals.
Questions readers ask
What are risk tolerance, risk capacity and risk need?
Tolerance is how much loss you can watch without selling. Capacity is how much loss your plan can absorb given its horizon and resources. Need is how much risk the goal requires to be reached. A sound allocation respects all three.
How do I calculate the return I need for a goal?
Divide the target by what you have, raise the result to the power of one over the years, and subtract one. Rs 60 lakh to Rs 1.2 crore in eight years needs about 9.05 percent a year.
How much equity should I hold close to retirement?
That depends on the three risks for your own plan. In the worked example, the goal needed about 46 percent equity on assumed returns and capacity capped it near 60 percent, well below the 90 percent a one axis questionnaire pointed to.
The cards
4 cards. Swipe, or tap to open.
Reading path
Stop 2 of 8 on Before you pick a card
Related
- One profile, many goalsPointing one Moderate label at a two year flat deposit and a 25 year retirement pot loses at both ends; the deposit falls short and the far pot ends Rs 24.18 lakh lower.Portfolio construction . . 5 min
- A risk profile has an expiry dateTwo years from a college goal, a 35 percent crash leaves a 90 percent equity saver Rs 10 lakh short while one who glided to 25 percent equity lands funded.Portfolio construction . . 6 min
- Who sells first: a household's real risk levelA shared portfolio is held by consensus and sold by veto, so the account's risk level is the lower partner's tolerance, not the average.Portfolio construction . . 4 min
Educational content only. Figures are illustrative and computed on historical or representative data for teaching purposes, not investment advice. Past performance does not guarantee future returns. Sourced from NSE, BSE, SEBI, AMFI and RBI public data.