

Portfolio construction..5 min read
The risk you get paid for
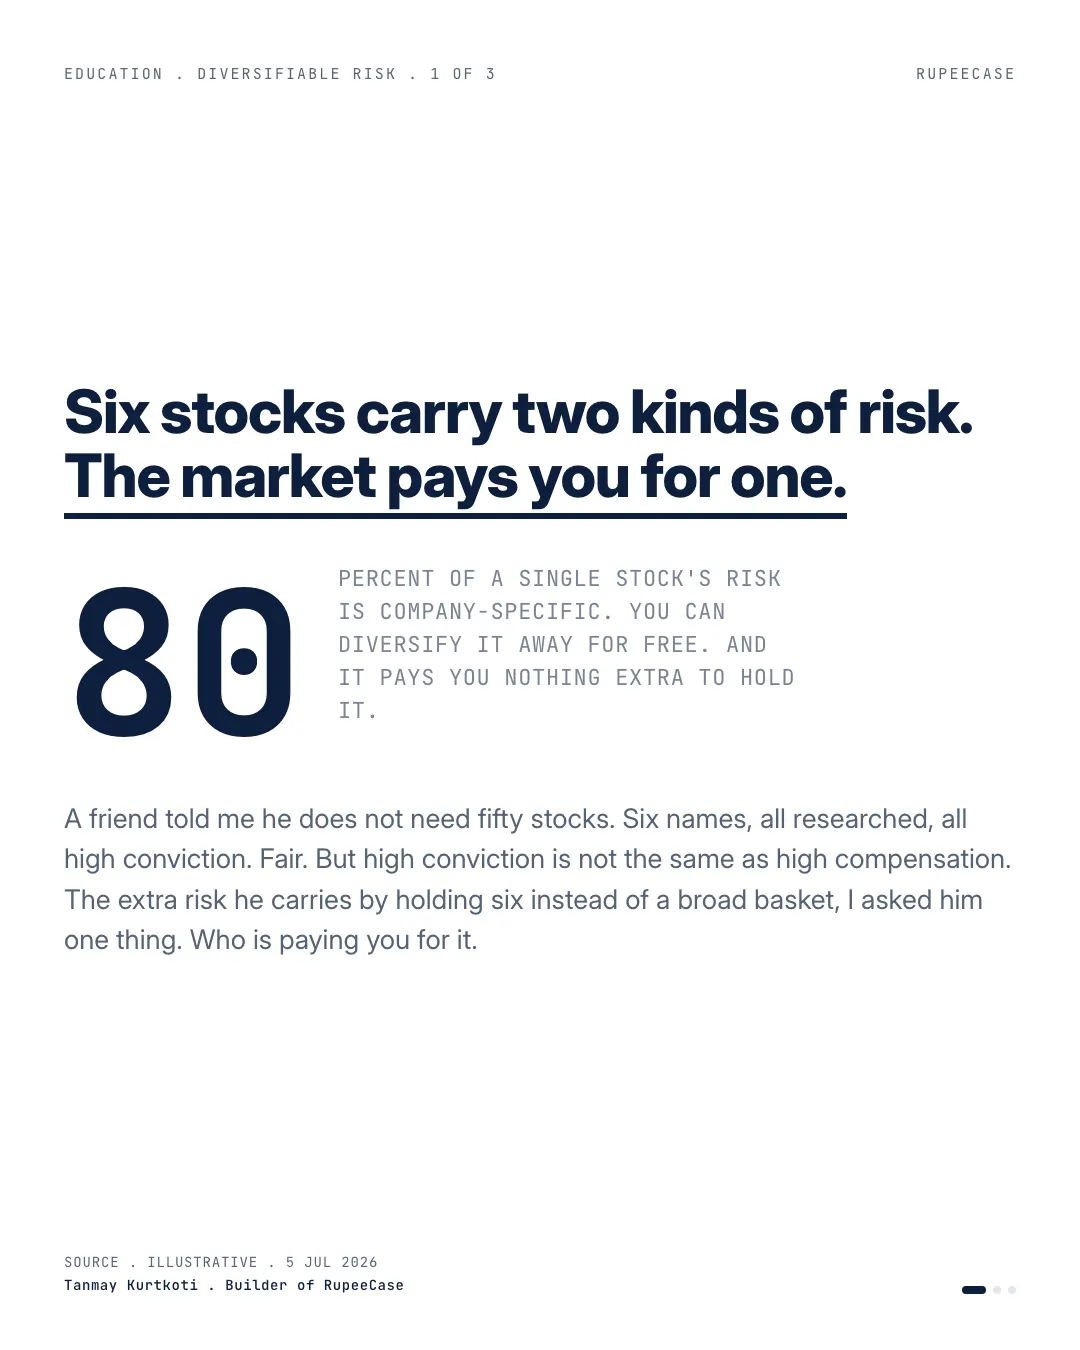
About 80 percent of a single stock's volatility is company specific and unrewarded, and an equal weight basket sheds it from 40 percent at one name to about 19 at thirty.
By Tanmay Kurtkoti, founder of QC Alpha and builder of RupeeCase
A friend told me he doesn't need fifty stocks.
Six names. All researched, all high conviction. And I get the instinct. Fifty stocks can feel like admitting you don't know which ones will work.
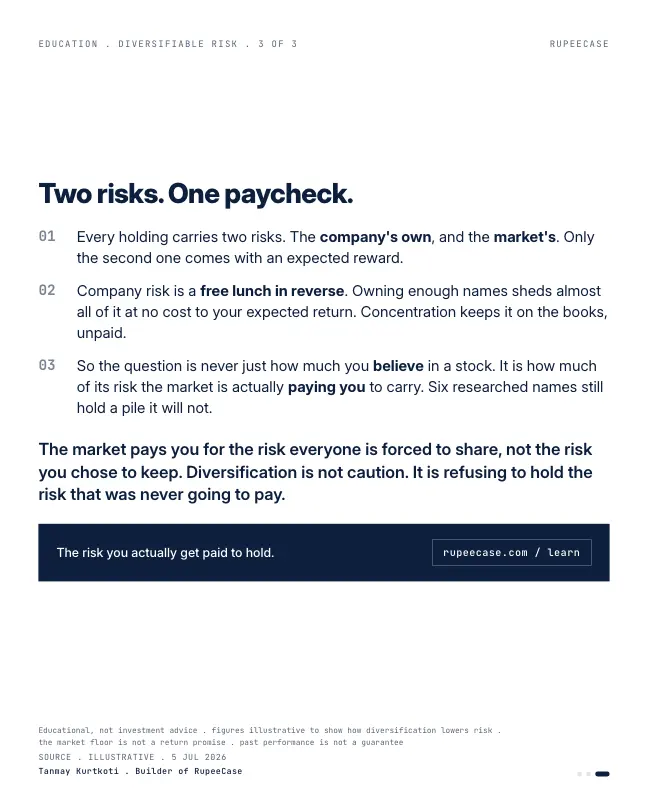
But here is the part the confidence hides. Every stock you hold carries two completely different risks, and only one of them ever pays you.
The first is the company's own risk. The factory fire, the CEO who quits, the product that flops, the fraud nobody saw coming. Roughly 80 percent of a single stock's volatility is this kind, specific to that one name. The second is market risk, the tide that moves every boat, the thing you cannot escape no matter how many stocks you own.
Here is what took me years to really absorb. The market hands you an expected return for holding the second risk. It pays you nothing for the first.
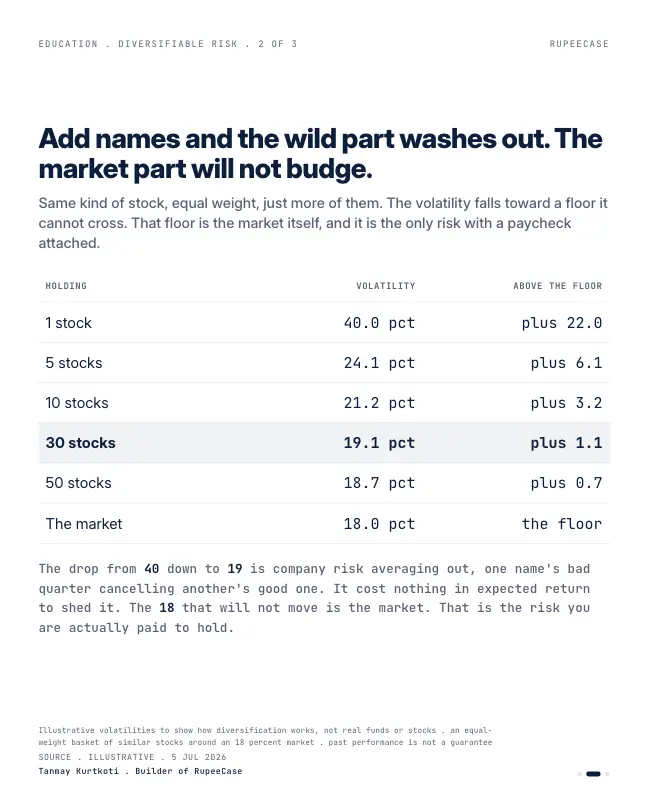
And the first one is free to get rid of. Watch what happens as you add names to an equal-weight basket. One stock sits near 40 percent volatility. Five stocks, 24. Ten, 21. Thirty, 19. Then it just stops, resting on a floor around 18 that is the market itself. One name's bad quarter cancels another's good one, and the company-specific risk quietly averages away. That drop from 40 to 19 cost nothing in expected return. You shed it for free.
So my friend's six researched names are carrying a pile of risk the market was never going to reward. Not because the research is bad. Because concentration keeps the unpaid risk on the books.
Oldest idea in portfolio theory, and still the most ignored. Diversification is not caution. It is refusing to hold the risk that was never going to pay.
Where the 40, 24 and 19 come from
Those numbers are not magic. They fall out of one short formula, and once you see it you can redo the whole curve on paper.
Take an equal weight basket of N stocks. Give each stock the same volatility, call it s, and the same average correlation with every other stock, call it r. The basket's volatility is s times the square root of (r plus (1 minus r) divided by N). With s at 40 percent and r at 0.20, one stock gives 40. Five give 40 times the square root of 0.36, which is 24. Ten give about 21.2. Thirty give about 19.0. And as N gets very large, the second term goes to zero and you are left with 40 times the square root of 0.20, about 17.9. That is the floor.
The same formula explains the 80 percent. For a single stock, the share of its variance that is company specific is 1 minus r. With r at 0.20, that is 80 percent.
Six names against thirty, in rupees
Put Rs 6,00,000 into six stocks, Rs 1,00,000 each. On the illustration's numbers the basket runs at about 23.1 percent volatility. A one standard deviation move, which on a normal curve is matched or exceeded roughly one year in three, is about Rs 1,38,600.
Now spread the same Rs 6,00,000 across thirty names, Rs 20,000 each. Volatility drops to about 19.0 percent. The same one standard deviation move is about Rs 1,14,300. Rs 24,300 less swing, and the expected return has not changed, because each stock was assumed to carry the same expected return in both baskets.
Run your own numbers below. Put in 50 names and the basket is already within a whisker of the floor. Push the correlation up to 0.5 and watch the floor rise: when stocks move together, there is less to diversify away.
At six names, 40 percent of the basket's variance is still company specific. That is the unpaid pile. At thirty it is about 12 percent.
What the floor looked like this year
The floor is not a fixed 18. It is whatever the market itself is doing. Over the twelve months to 30 Sep 2026 I measured the Nifty 50 from its daily closes.
Nifty 50 volatility, annualised from daily closes
NSE, 30 Sep 2025 to 30 Sep 2026
Nifty 50 deepest fall from a closing high
NSE, 30 Sep 2025 to 30 Sep 2026
Nifty 50 price change over the year
NSE, 30 Sep 2025 to 30 Sep 2026
That is the risk no amount of diversification inside Indian equity would have removed. A thirty stock basket of Nifty names would have felt most of that 15.2 percent fall. What it would not have felt is the extra damage from any one of its names having a terrible year on its own. That second kind of damage is exactly what six names keep.
MythSix well researched stocks are safer than fifty I barely know.
FactResearch can lower the odds of a bad pick. It cannot remove the fire, the fraud or the resignation nobody saw coming. Only more names does that, and it costs no expected return.
The free Learn module on modern portfolio theory builds this from the ground up, with correlation, the efficient frontier and a quiz. The Sharpe and volatility calculator lets you test the return you get per unit of the risk that is left. And the post on single stock skew shows why a few names also make the rare big winners easier to miss.
Questions readers ask
How many stocks do you need to be diversified?
On the usual textbook numbers, most of the company specific risk is gone by twenty to thirty equally weighted stocks. With each stock at 40 percent volatility and an average correlation of 0.20, a thirty stock basket runs at about 19 percent against a floor near 18. The exact count depends on how closely the stocks move together.
What is the difference between systematic and unsystematic risk?
Systematic risk is market risk, the part that moves all stocks together, and the market pays an expected return for bearing it. Unsystematic risk is specific to one company, such as a plant shutdown or a management exit, and it averages away as names are added. Over the year to 30 Sep 2026 the Nifty 50 itself ran at about 13.5 percent volatility, which is systematic risk no Indian equity basket could have avoided.
Does diversification reduce returns?
Spreading money across more stocks with the same expected return lowers volatility without lowering the expected return of the basket. What it does change is the chance of an outsized result in either direction. A concentrated portfolio can beat a diversified one in a given year, and it can also trail it badly.
The cards
3 cards. Swipe, or tap to open.
Explore next
Learn it properly, then see it applied.
- StrategyAllcap strategyNifty Total Market, 50 stocks, every 2 weeks
- CalculatorAsset allocation by risk profileFree, with the formula and a worked example
- Free module 4.1Modern Portfolio Theory, What Actually Matters11 min read
- CalculatorSharpe and volatilityFree, with the formula and a worked example
- Blog topicPortfolio construction notes33 notes
Related
- Single stock skew: own the haystackBessembinder found 57 percent of US stocks since 1926 did worse than a Treasury bill and four percent of names created all the net wealth.Portfolio construction . . 6 min
- Your biggest asset is not in your portfolioA 30 year old's future paycheques can be 15 to 20 times the brokerage account, so a portfolio should diversify away from the job, not toward it.Portfolio construction . . 5 min
- Twenty funds, one betAt the 0.85 correlation Indian diversified equity funds show against each other, twenty funds buy 1.17 effective bets against 1.14 for five.Portfolio construction . . 11 min
Educational content only. Figures are illustrative and computed on historical or representative data for teaching purposes, not investment advice. Past performance does not guarantee future returns. Sourced from NSE, BSE, SEBI, AMFI and RBI public data.