

Portfolio construction..6 min read
A risk profile has an expiry date
Two years from a college goal, a 35 percent crash leaves a 90 percent equity saver Rs 10 lakh short while one who glided to 25 percent equity lands funded.
By Tanmay Kurtkoti, founder of QC Alpha and builder of RupeeCase
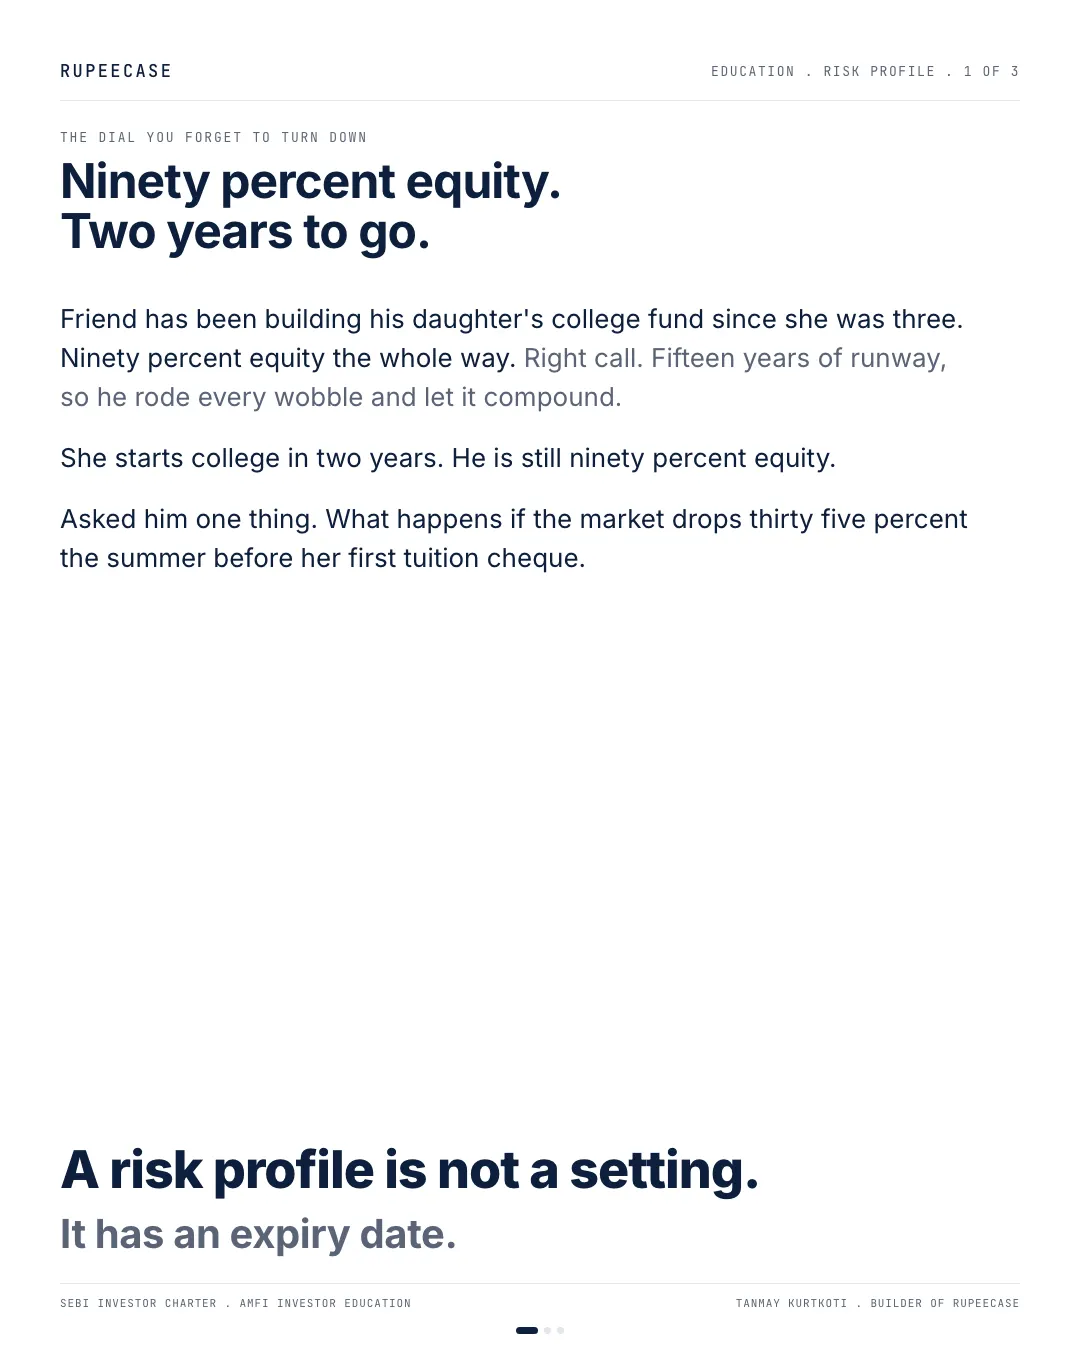
My friend has been putting money into his daughter's college fund since she was three years old. Ninety percent equity, the whole way. It was the right call. He had fifteen years of runway, so he rode every dip and let the thing compound.
She starts college in two years. He is still ninety percent equity. That is the part he had not thought about.
I asked him one question. What happens if the market falls thirty five percent the summer before her first tuition cheque.
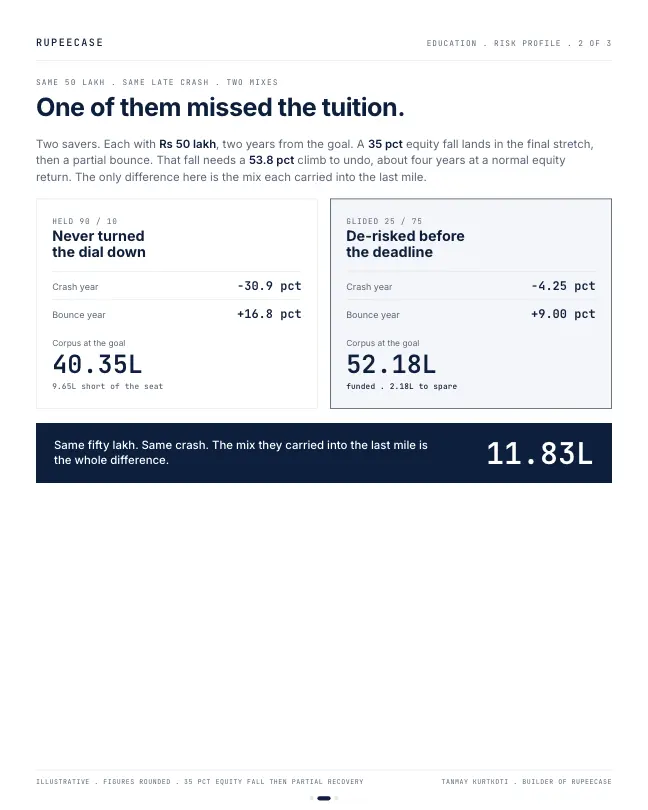
Here is why that lands. A thirty five percent fall needs a fifty four percent climb just to get back to flat. At a normal equity return that is about four years. Two years from the goal, nobody has four years.
Run the numbers. Two savers, same fifty lakh, both two years out. A crash hits the final stretch. The one who stayed ninety percent equity lands at forty lakh, nearly ten lakh short of the seat. The one who had already glided down to twenty five percent equity lands at fifty two lakh, funded with room to spare. Same market. The only difference is the mix each carried into the last mile.
The honest catch. If the crash never comes, the cautious one gives up a few lakh of upside. That is the premium. Near the finish you are not paying for growth anymore, you are paying to make sure the goal actually gets funded.
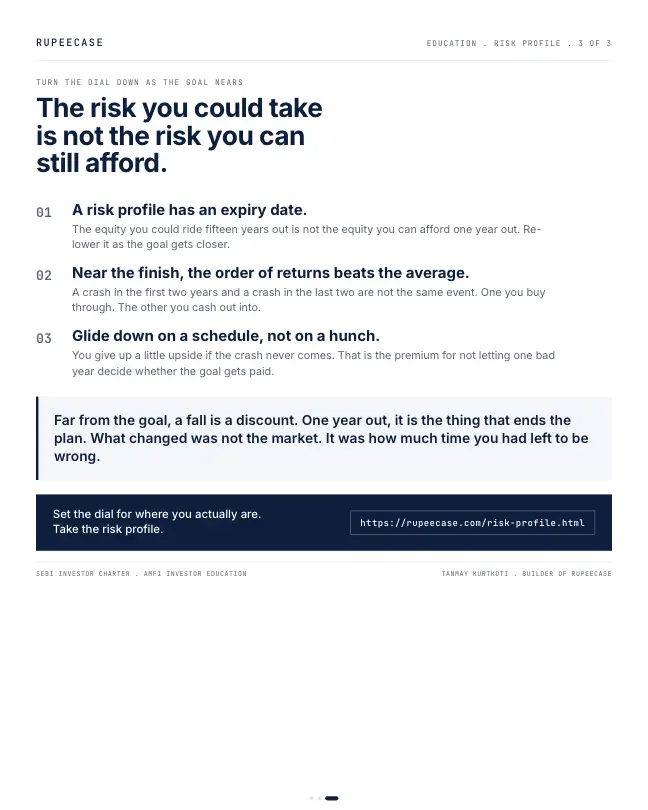
A risk profile is not a dial you set once and forget. It has an expiry date. The equity you could ride at year one is not the equity you can afford at year fourteen. Glide it down on a schedule, not on a hunch.
Set the dial for where you actually are:
Two parts of a risk profile, and only one of them ages
A risk profile answers two different questions. The first is how much a fall would bother you, your willingness. The second is how much a fall could actually hurt the plan, your capacity. Willingness is mostly temperament, and it moves slowly. Capacity is mostly arithmetic, and it shrinks every year a goal gets closer.
SEBI writes both into the rules for registered investment advisers. Regulation 16 of the SEBI (Investment Advisers) Regulations, 2013 asks the adviser to assess a client's capacity for absorbing loss, not just appetite, and to update the client information and risk assessment periodically. The regulator treats a risk profile as something that goes stale. The risk profile page on RupeeCase asks the same two kinds of questions, including the horizon of the goal.
A glide path you can write down today
A glide path is the schedule that turns "less equity as the goal gets near" into dates. The free asset allocation calculator uses one simple version: whatever your profile says, it caps equity at 60 percent when the goal is under 7 years away, 40 percent under 5 years and 20 percent under 3 years.
- Profile decides, up to 90% equity
Time can absorb a deep fall and the recovery after it.
- Equity capped at 60%
Start moving new money and some old money into debt.
- Equity capped at 40%
A 35% fall at 40% equity costs the plan about 14%, before debt returns.
- Equity capped at 20%
The money is close to being spent. Protect the amount, not the growth.
Writing it down matters more than the exact numbers. A schedule decided at year one is a decision made on a calm day. The same decision made at year thirteen, after a strong rally, tends to come out as "one more year".
A real final stretch: Jan to Mar 2026
The opening uses a hypothetical 35 percent crash. You do not need one that deep to see the point. Between 31 Dec 2025 and 30 Mar 2026, the Nifty 50 fell from 26,129.60 to 22,331.40, a 14.5 percent fall in one quarter. The Nifty Composite G-sec Index slipped 1.4 percent over the same days, from 3,052.91 to 3,009.05.
Take a goal fund of Rs 20,00,000 with two years to go. At 90 percent equity, that quarter takes it to about Rs 17,35,479, down 13.2 percent. At 20 percent equity, the cap the calculator uses under three years, it ends at about Rs 19,18,869, down 4.1 percent. The gap is Rs 1,83,390 in three months, and the money is needed in 21 months.
Rs 20 lakh at 90% equity, Jan to Mar 2026
NSE closes, 31 Dec 2025 to 30 Mar 2026
Rs 20 lakh at 20% equity, same quarter
NSE closes, 31 Dec 2025 to 30 Mar 2026
Nobody knew in December that the quarter would go that way. That is the whole argument for a schedule.
Run your own last mile
Change the inputs below to your own goal. The calculator applies one fall to the equity part and one return to the debt part, and tells you how far the goal is from funded.
Set equity to 20 and the same 35 percent crash leaves Rs 18,92,000, and the rise needed falls to 5.7 percent. Debt can do that in about a year.
The year the market goes up instead
What would you do?
Two years before the goal, your schedule says cut equity from 40% to 20%. The market has just had a strong six months.
- Wait a year, the rally looks strong
You may earn more. You also carry 40% equity into the last 12 months, where a 35% fall would cost the plan about 14% with no time left to recover.
- Follow the schedule
You give up some upside if the rally runs on. A 35% fall now costs about 7% of the fund, which a year of debt returns can cover.
Equity fall of 35% applied to the equity share, debt return ignored. Worked example, not a forecast.
The free Learn module on risk management covers what a drawdown really costs and how allocation sizing works as a risk control, with a quiz at the end. If you have more than one goal, one profile, many goals shows why each goal needs its own dial, and three risks separates them.
Questions readers ask
How should asset allocation change as a goal gets closer?
A common approach is a glide path: a written schedule that lowers the equity share as the goal date nears. One simple version caps equity at 60 percent under 7 years, 40 percent under 5 and 20 percent under 3, whatever the original risk profile said.
How often should a risk profile be reviewed?
SEBI's rules for investment advisers ask for client information and the risk assessment to be updated periodically. A practical trigger is any change in the goal date, income or the amount needed, plus a fixed yearly check, because capacity for loss shrinks as a goal gets closer.
How long does it take to recover from a 35 percent fall?
A 35 percent fall needs a 53.8 percent rise to get back to the start. At 10 percent a year that takes about four and a half years, which is why a deep fall close to a goal date hurts more than the same fall early on.
The cards
3 cards. Swipe, or tap to open.
Related
- Capacity, tolerance, need: the three risksA questionnaire scored one risk and pointed at 90 percent equity; capacity eight years from retirement and a need of about 9 percent a year both pointed near 60.Portfolio construction . . 4 min
- One profile, many goalsPointing one Moderate label at a two year flat deposit and a 25 year retirement pot loses at both ends; the deposit falls short and the far pot ends Rs 24.18 lakh lower.Portfolio construction . . 5 min
- Who sells first: a household's real risk levelA shared portfolio is held by consensus and sold by veto, so the account's risk level is the lower partner's tolerance, not the average.Portfolio construction . . 4 min
Educational content only. Figures are illustrative and computed on historical or representative data for teaching purposes, not investment advice. Past performance does not guarantee future returns. Sourced from NSE, BSE, SEBI, AMFI and RBI public data.