

Portfolio construction..6 min read
Allocation drift: the risk you didn't choose
An untouched 60/40 drifts to about 71/29 in ten years at 12 and 6.5 percent, and falls 27.8 instead of 23.2 percent when equity drops 40.
By Tanmay Kurtkoti, founder of QC Alpha and builder of RupeeCase
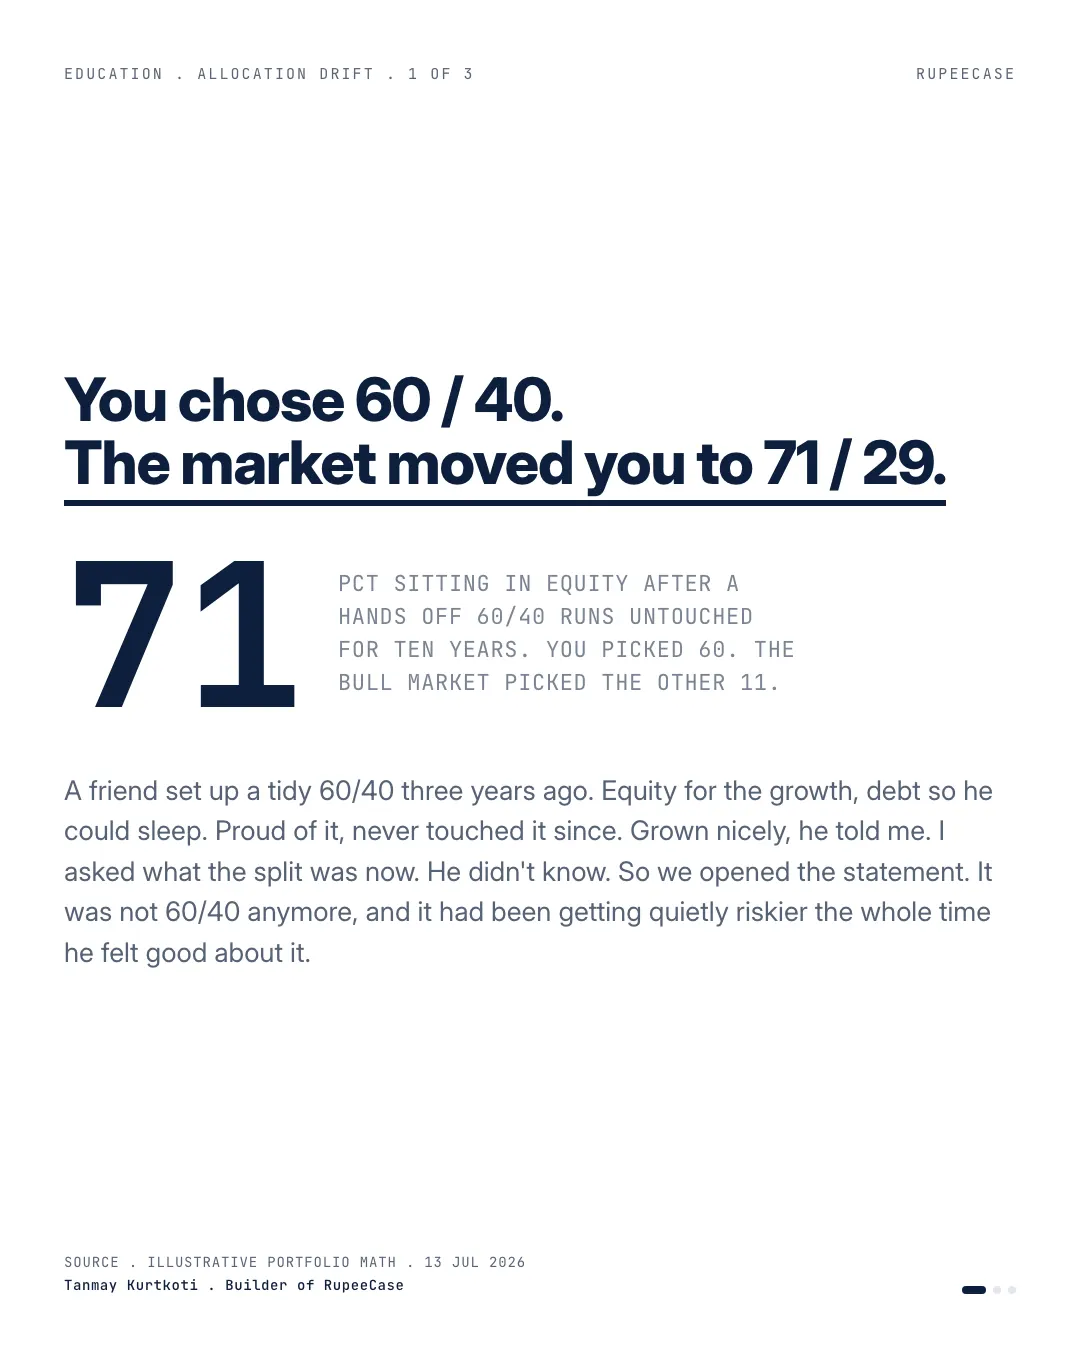
A friend set up a tidy 60/40 three years ago. Equity for the growth, debt so he could sleep at night. He was proud of it, and then he never touched it again.
Grown nicely, he told me. I asked him what the split was now. He didn't know. So we opened the statement, and it was not 60/40 anymore.
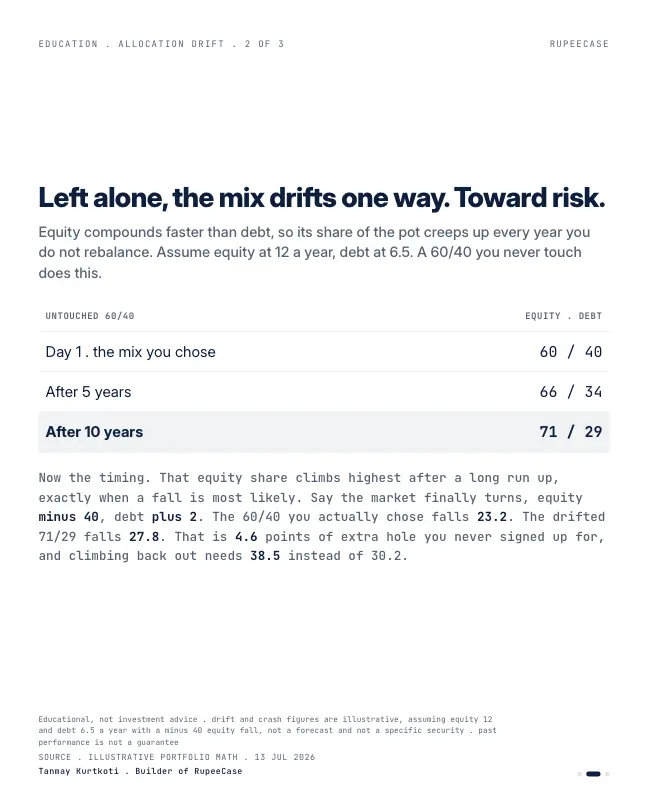
Here is the quiet mechanism nobody warns you about. Equity compounds faster than debt, so its share of your portfolio creeps up every single year you leave the mix alone. Assume equity earns about 12 a year and debt about 6.5. A 60/40 you never rebalance drifts to roughly 66/34 in five years, and about 71/29 in ten. Eleven points more equity, eleven points more risk, and not one of those points was a decision you made.
Now the part that actually costs you. That equity share is at its highest after a long run up, which is exactly when a correction is most likely. When the market finally turns, say equity down 40 and debt up 2, the drifted 71/29 falls about 27.8 percent. The 60/40 you actually chose falls 23.2. That is nearly 5 extra points of drawdown on a bet you never placed, and it needs a bigger bounce just to climb back to even.
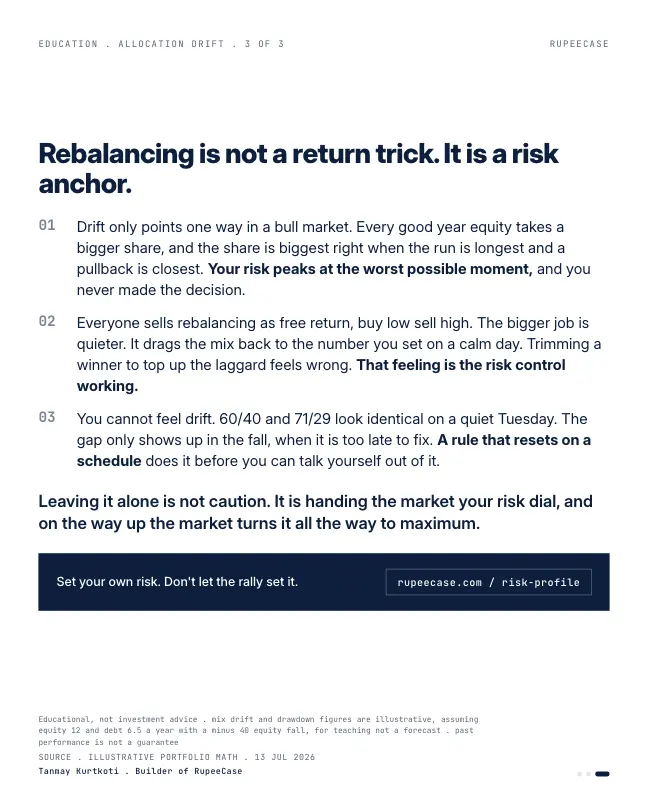
This is why I think rebalancing gets sold the wrong way. Everyone frames it as a free-return trick, buy low and sell high. The bigger job is quieter. It drags your mix back to the risk level you picked on a calm day, before the market talked you into carrying more.
Leaving it alone is not caution. It is handing the rally your risk dial, and on the way up the rally turns it all the way to maximum:
Drift runs both ways: a real 60/40 from Oct 2024
The ten year example above uses assumed returns. So I ran the same question on actual NSE closes, over a window that did not go up in a straight line.
Put Rs 10,00,000 into a 60/40 on 14 Oct 2024: Rs 6,00,000 tracking the Nifty 50 and Rs 4,00,000 tracking the Nifty Composite G-sec Index. The Nifty 50 closed at 25,127.95 that day and the G-sec index at 2,828.72. Then leave it alone.
By 30 Sep 2026 the Nifty 50 closed at 22,620.45, down 9.98 percent. The G-sec index closed at 3,101.54, up 9.64 percent. The equity sleeve is worth about Rs 5,40,126, the debt sleeve about Rs 4,38,579. The mix is now 55.2 percent equity and 44.8 percent debt.
The equity share of an untouched 60/40 started at 60 percent on 14 Oct 2024, touched 59.1 percent at the end of Dec 2025 and ended at 55.2 percent on 30 Sep 2026.
NSE, Nifty 50 and Nifty Composite G-sec Index quarter end closes, 14 Oct 2024 to 30 Sep 2026 (NSE bhavcopy). Price index for equity, dividends of about 1.2% a year not included.
Same mechanism, opposite direction. After a fall the mix holds less equity than you chose, so a rebalance on 30 Sep 2026 would have bought about Rs 47,000 of equity and sold the same amount of debt to restore 60/40. That is the trade almost nobody wants to make after two flat years. It is also the trade that keeps the plan honest. One caveat on the numbers: the Nifty 50 here is the price index, and its dividend yield was 1.22 on 30 Sep 2026 by the NSE data, so a real equity sleeve did a little better than this line.
Weight, drift and the band
You do not need a statement to see drift coming. One formula does it. The equity weight after a period is the equity value grown by its return, divided by the whole portfolio grown by both returns.
For the friend in the opening: 60 percent equity grown at 12 percent for five years is 60 x 1.762 = 105.7. Forty percent debt grown at 6.5 percent is 40 x 1.370 = 54.8. Equity is 105.7 out of 160.5, which is 65.9 percent. That is the 66/34 in the post.
A band rule turns that number into a decision. Pick a band, say 5 points either side of 60. Inside the band you do nothing. Outside it, you trade back to target. On the real NSE window above, the mix sat inside a 5 point band the whole time and touched 55.2 only at the very end, so a band investor would have been right at the edge on 30 Sep 2026. A calendar investor rebalancing every year would have traded twice. The drift threshold calculator sizes the trade for your own numbers.
What rebalancing is for
MythRebalancing is a trick to earn extra return by selling high and buying low.
FactIts main job is to hold the risk you chose. Sometimes it adds return, sometimes it costs some. It always resets the mix.
MythDrift only matters in a bull market.
FactFrom Oct 2024 to Sep 2026 an untouched 60/40 drifted down to 55/45, because equity fell 10 percent while government bonds rose 9.6 percent.
The free Learn module on rebalancing strategies works through calendar, band and signal driven rules on a 60/40 in rupees, with the tax side of every trade. It also has a quiz and a certificate if you want to test yourself.
The friction worth knowing
Rebalancing a mix is not free. Selling equity held 12 months or less is taxed at 20 percent on the gain, and longer holdings at 12.5 percent above Rs 1.25 lakh of gains a year, for transfers from 23 July 2024. Debt fund units bought on or after 1 April 2023 are taxed at your slab rate whatever the holding period.
So the cheapest rebalance is often the one done with new money. An investor who adds Rs 20,000 a month can point it at whichever sleeve is under target, and the mix drifts back without a single sale. Only when cash flow cannot close the gap does a sale earn its tax.
If you want the version of this on a stock basket, rebalance cadence shows how one runner takes over an equal weight book between rebalances.
Questions readers ask
How much can a 60/40 portfolio drift in a year?
It depends on how far apart equity and debt returns are. With actual NSE closes, an untouched 60/40 started on 14 Oct 2024 sat at 57.9 percent equity a year later and 55.2 percent by 30 Sep 2026, when the Nifty 50 was down about 10 percent and the G-sec index up about 9.6 percent.
When should I rebalance an equity and debt portfolio?
The two common rules are a fixed calendar, such as once a year, and a band, such as trading only when equity moves more than 5 points from target. The calendar is simpler; the band trades less. Either works better than having no rule at all.
Does rebalancing reduce returns?
Over a long rally it usually does a little, because it keeps selling the asset that keeps rising. In exchange it keeps the drawdown close to the one you signed up for. In the example above, a drifted 71/29 falls 27.8 percent in a 40 percent equity crash against 23.2 percent for the 60/40.
The cards
3 cards. Swipe, or tap to open.
Related
- Rebalancing is not free. And it is not always money.Two 10 percent sleeves at 25 percent volatility earn a 1.88 point bonus at minus 0.20 correlation and 0.16 at plus 0.90, while a trending decade charges 1.39 points a year.Portfolio construction . . 11 min
- Rebalance cadence: the latency nobody readsThe same thirty names rebalanced quarterly and fortnightly landed at 30.2 and 33.8 percent CAGR over five years, because drift is a silent overweight.Portfolio construction . . 6 min
- Rebalancing harvests volatilityAn equal weight five fund SIP drifted to 38/17/16/15/14 in two years, and a two asset napkin shows how rebalancing at the swing turns a flat round trip into a 10 percent gain.Portfolio construction . . 6 min
Educational content only. Figures are illustrative and computed on historical or representative data for teaching purposes, not investment advice. Past performance does not guarantee future returns. Sourced from NSE, BSE, SEBI, AMFI and RBI public data.