

Portfolio construction..6 min read
Single stock skew: own the haystack
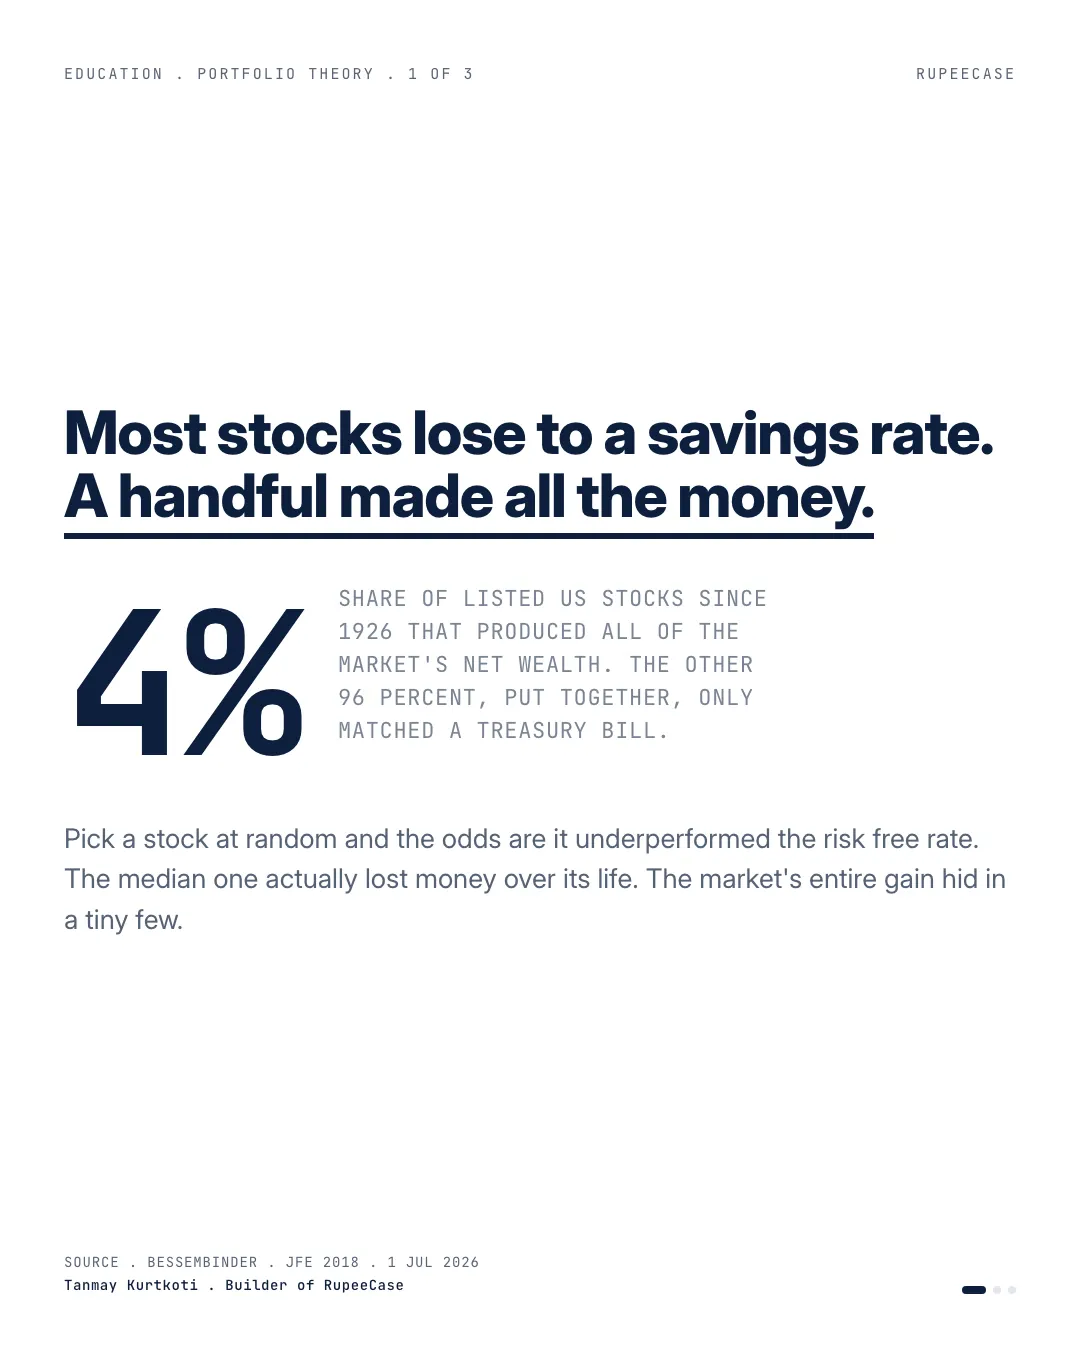
Bessembinder found 57 percent of US stocks since 1926 did worse than a Treasury bill and four percent of names created all the net wealth.
By Tanmay Kurtkoti, founder of QC Alpha and builder of RupeeCase
A friend asked me last week for the one stock to buy and forget for the next ten years. Just tell me the name, he said. I pulled up a study I keep going back to, because the answer it gives is not the one anyone wants.
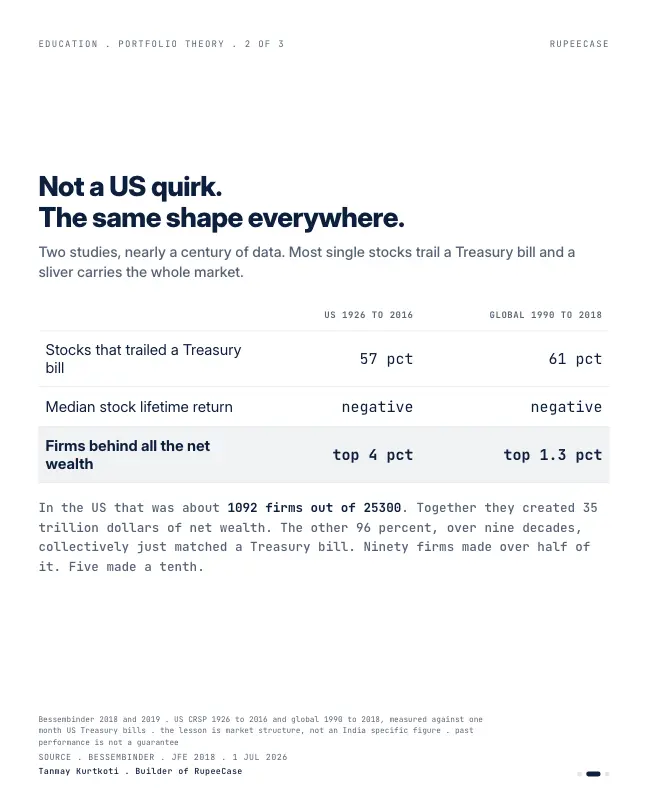
Hendrik Bessembinder went through every US stock in the record since 1926, about 25,300 of them. Fifty seven percent, over their entire lifetimes, did worse than a one month Treasury bill. That is basically the risk free rate, the return you get for taking no equity risk at all. The median stock actually lost money. Not underperformed. Lost money.
So where did the famous long run return of the stock market come from? Four percent of the names. That sliver, about 1092 companies, created all of the net wealth, roughly 35 trillion dollars of it. The other 96 percent, added together across nine decades, just matched a Treasury bill. Ninety firms made over half. Five made a tenth.
Before anyone files this under American exceptionalism, the same team ran it on global stocks from 1990. Sixty one percent trailed a US T-bill. The same lopsided shape everywhere you look.
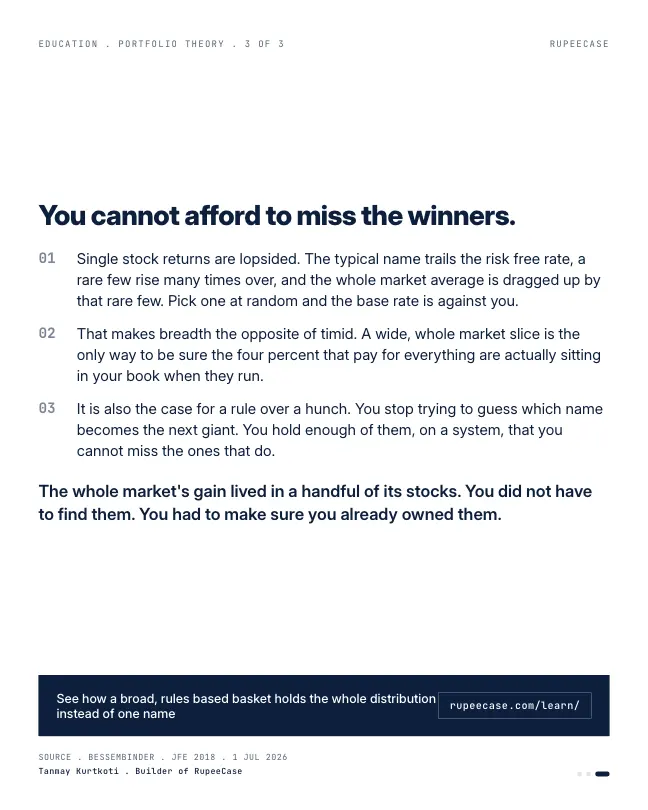
Here is what it does to the one stock question. If almost all the return lives in a handful of names, the odds that you, picking by hand, land on them are brutal. Which flips how I read diversification. It is not the timid choice. Owning a wide, whole market slice is the only reliable way to be sure the four percent that pay for everything are actually in your portfolio when they run.
You do not have to find the needle. You have to own enough of the haystack that you cannot miss it
The same shape, one year of Indian sectors
You do not need ninety years of US data to see the spread. One year of NSE sector indices shows it.
Between 30 Sep 2025 and 30 Sep 2026 the Nifty 50 fell 8.09 percent on price. Inside that same year, the Nifty Metal index rose 27.12 percent and the Nifty Pharma index 23.23 percent. The Nifty IT index fell 17.68 percent and the Nifty FMCG index 18.65 percent, and the Nifty India Railways PSU index 24.54 percent. That is a gap of about 52 points between the best and worst of these sector baskets, and each of them is already an average of many companies.
- Nifty Metal27.12%
- Nifty Pharma23.23%
- Nifty 50-8.09%
- Nifty IT-17.68%
- Nifty FMCG-18.65%
- Nifty India Railways PSU-24.54%
NSE index closes, price return, 30 Sep 2025 to 30 Sep 2026 (NSE bhavcopy). Dividends not included.
Single stocks spread wider than sectors, because a sector index averages away the worst and the best of its own members. A one stock portfolio has no averaging at all. You get one draw from the distribution, and the distribution in the study above has a median below zero.
Position size is where skew turns into rupees
Skew is a statement about the market. Position size decides how much of it lands on you. The free Learn module on position sizing covers four ways to size a holding; the arithmetic below is the part everyone can redo on paper.
Take Rs 10,00,000. Put 40 percent, Rs 4,00,000, into Company A because you are sure about it. Company A falls 60 percent. You lose Rs 2,40,000, a quarter of everything, from one name. To get back to Rs 10 lakh, the remaining Rs 7,60,000 now has to rise 31.6 percent.
Now hold Company A at 5 percent, Rs 50,000. The same 60 percent fall costs Rs 30,000, which is 3 percent of the portfolio. The recovery needed is 3.1 percent. Same company, same fall, a completely different year.
That is the honest case for spreading out. Not that diversification makes you more money. It caps how much any one wrong guess can cost, so you stay in the game long enough for the few big winners to show up.
Two portfolios, the same conviction
The whole outcome rides on one draw
- Best case: you picked one of the rare big winners
- Median case: below the risk free rate, per the study
- A 60% fall in the stock is a 60% fall in the portfolio
The winners are in by construction
- Every big winner in the index is held at some weight
- One 60% fall at a 2% weight costs 1.2%
- You give up the dream of the single lucky pick
How many names is enough? The NSE gives a sense of scale. The Nifty 50 holds 50 companies and the Nifty 500 holds 500. On 30 Sep 2026 alone, 3,529 different securities traded on NSE, with 1,650 closing higher and 1,782 lower. Even on an ordinary day, the market is a crowd moving in two directions at once.
Companies in the Nifty 50
NSE Indices, index methodology
Companies in the Nifty 500
NSE Indices, index methodology
Securities traded on NSE on 30 Sep 2026
NSE bhavcopy, all series
How a rule handles conviction
Conviction is not the problem. Sizing by conviction is. The cleanest fix I know is a rule that sets a maximum weight per name before you ever look at the name. Equal weight does it automatically: in a 30 stock book, no name starts above 3.33 percent. A risk budget does it another way: decide you will lose no more than 1 percent of capital if a stop is hit, and the number of shares falls out of the arithmetic. The position size calculator does that sum for you.
- Set the cap firstDecide the largest weight any one name may hold, before you pick a single name.
- Set the risk budgetDecide the most one position may cost the portfolio, for example 1% of Rs 10 lakh, Rs 10,000.
- Size the positionWith a stop 10% below entry, Rs 10,000 of risk allows a Rs 1,00,000 position, 10% of the book.
- Take the smallerIf the cap is lower than the size the budget allows, the cap wins. Conviction never raises it.
For more on why breadth pays, the risk you get paid for separates the risk the market rewards from the risk it does not, and twenty funds, one bet shows how owning many funds can still leave you concentrated.
Questions readers ask
Is it risky to put all my money in one stock?
A single stock can fall far more than the market. If one stock is 40 percent of a Rs 10 lakh portfolio and it falls 60 percent, the portfolio loses Rs 2,40,000 and then needs a 31.6 percent gain just to get back to where it was.
How much of my portfolio should one stock be?
There is no single number, and this is a choice each investor makes. Common rules either cap every name at a fixed weight, such as equal weight across 20 to 50 stocks, or size each position so that a hit stop loses only a set share of capital, such as 1 percent.
Why do most stocks underperform the index?
Stock returns are skewed: a small share of companies produces very large gains and pulls the index average up, while the typical stock does far worse than that average. The Bessembinder study of US stocks since 1926 found that four percent of companies created all of the net wealth.
The cards
3 cards. Swipe, or tap to open.
Explore next
Learn it properly, then see it applied.
- Free module 4.1Modern Portfolio Theory, What Actually Matters11 min read
- StrategyAllcap strategyNifty Total Market, 50 stocks, every 2 weeks
- Free module 4.2Position Sizing8 min read
- CalculatorPosition size calculatorFree, with the formula and a worked example
- Blog topicPortfolio construction notes33 notes
Related
- The risk you get paid forAbout 80 percent of a single stock's volatility is company specific and unrewarded, and an equal weight basket sheds it from 40 percent at one name to about 19 at thirty.Portfolio construction . . 5 min
- Your biggest asset is not in your portfolioA 30 year old's future paycheques can be 15 to 20 times the brokerage account, so a portfolio should diversify away from the job, not toward it.Portfolio construction . . 5 min
- Twenty funds, one betAt the 0.85 correlation Indian diversified equity funds show against each other, twenty funds buy 1.17 effective bets against 1.14 for five.Portfolio construction . . 11 min
Educational content only. Figures are illustrative and computed on historical or representative data for teaching purposes, not investment advice. Past performance does not guarantee future returns. Sourced from NSE, BSE, SEBI, AMFI and RBI public data.