

Portfolio construction..11 min read
Twenty funds, one bet
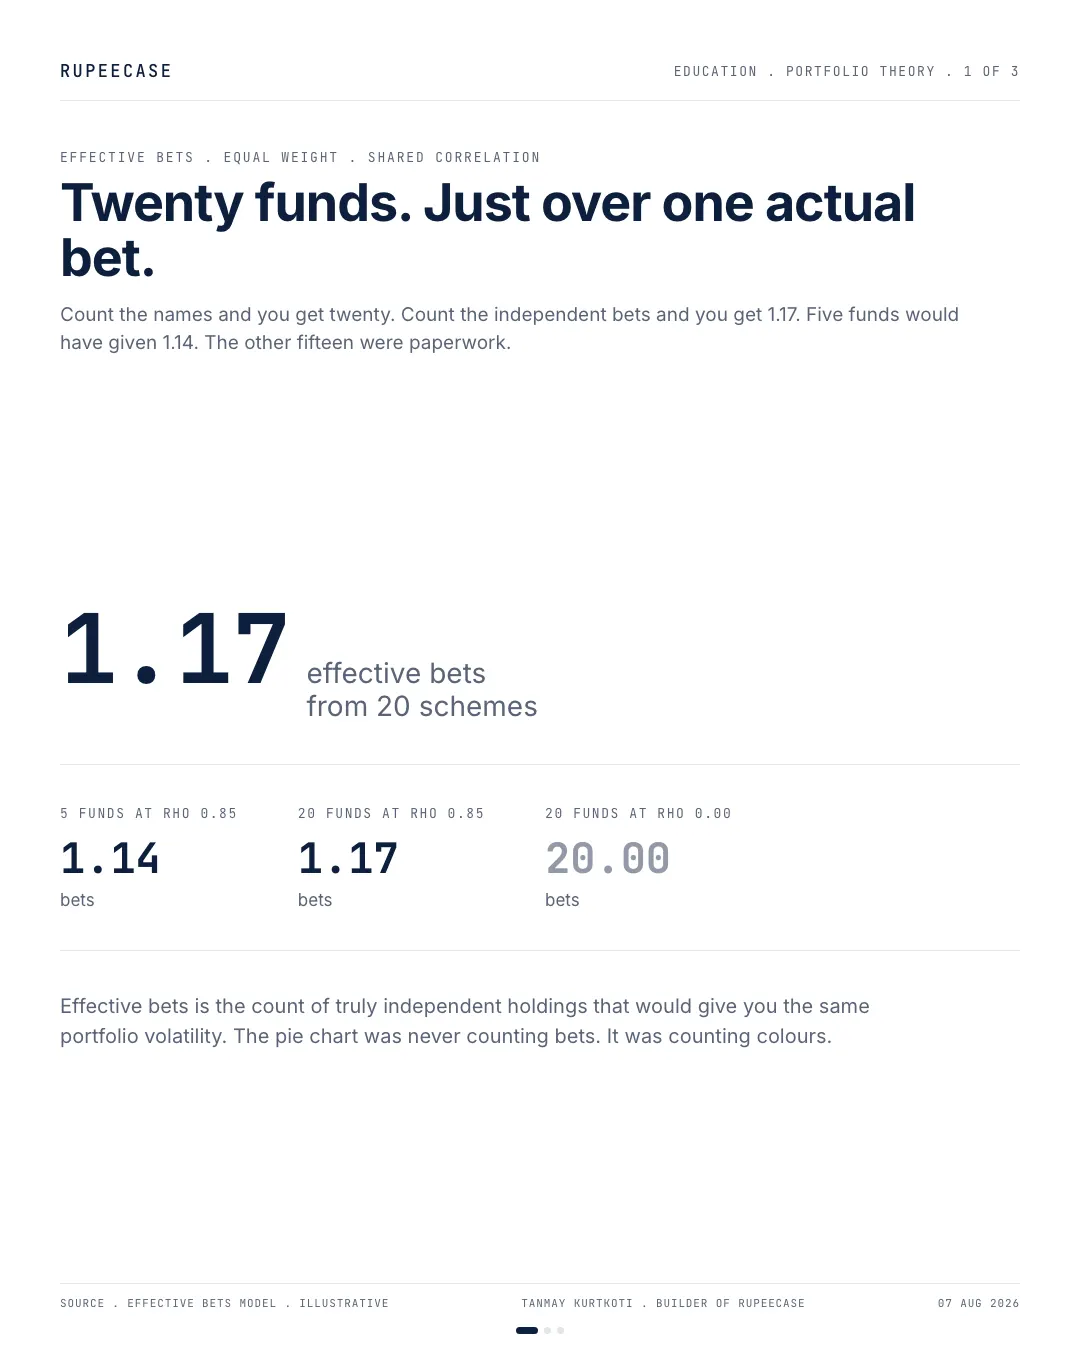
At the 0.85 correlation Indian diversified equity funds show against each other, twenty funds buy 1.17 effective bets against 1.14 for five.
By Tanmay Kurtkoti, founder of QC Alpha and builder of RupeeCase
Thursday evening, a friend forwards me a screenshot of his mutual fund dashboard. Twenty schemes. He has been adding one every few months for about six years and the app is rewarding him with a pie chart in twenty colours, which apparently is what safety looks like now.
"Diversified enough?" he types. "Or should I put two more in?"
I counted the names first, because that is the easy count. Twenty, he is right about that. Then I counted the bets, which is a different exercise entirely and has an actual formula behind it.
The answer came back at 1.17.
Twenty fund names bought him 1.17 independent bets. Five funds would have bought 1.14. The other fifteen were paperwork.
So I stopped counting names and counted bets instead
Hold onto the plain English version before any algebra arrives. The effective number of bets in a portfolio is the count of genuinely independent holdings that would produce the same portfolio volatility you are actually running. If twenty funds wobble as much as one fund does, you own one bet with twenty account numbers stapled to it.
The model is small enough to say in a sentence. Take n holdings in equal weight, assume every pair of them moves together with the same correlation, call it rho, and the portfolio's variance measured against a single holding's variance is one over n, plus n minus one over n, times rho. Effective bets is one divided by that.
Here is that sentence as a calculator. Start with his twenty funds at 0.85, then move only the correlation and watch which input the answer actually cares about.
Two inputs. The count, and the correlation. The correlation does nearly all the work, which is precisely the input that never appears on a fund page.
Run it at zero correlation and you get the answer everyone already carries around. Five funds gives 5.00 bets, ten gives 10.00, twenty gives 20.00. Every name you add is a whole new bet. That is the arithmetic the twenty-slice pie chart is quietly selling.
Now run it at the correlation level Indian diversified equity funds actually show against one another, up in the 0.85 neighbourhood, and the pie chart falls over.
Those three solid bars are five funds, ten funds and twenty funds. They are the same bar. You have to look twice to notice the bottom one is a hair longer. The pale bar underneath is what twenty funds would deliver if the correlation genuinely were zero, and the distance between that pale bar and those three navy stubs is the entire gap between what the dashboard implies and what he owns.
The grid is worth reading down, not across
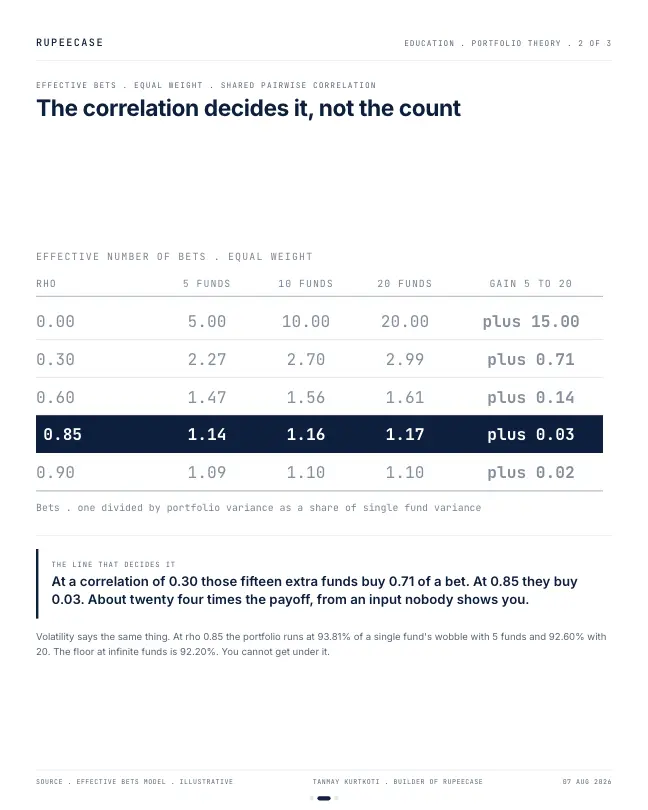
The chart shows one slice of the model. The full grid is where the argument gets settled, because it lets you see what happens when you vary the input that matters instead of the input that is easy to change.
| Pairwise correlation | 5 funds | 10 funds | 20 funds |
|---|---|---|---|
| 0.00 | 5.00 | 10.00 | 20.00 |
| 0.30 | 2.27 | 2.70 | 2.99 |
| 0.60 | 1.47 | 1.56 | 1.61 |
| 0.85 | 1.14 | 1.16 | 1.17 |
| 0.90 | 1.09 | 1.10 | 1.10 |
Reading across a row is what an investor does when he adds a fund. Reading down a column is what he does when he adds a genuinely different kind of holding. The rows flatten to nothing once rho climbs, and the columns stay steep the whole way. At a correlation of 0.30 those same fifteen extra funds buy you 0.71 of a bet, which is roughly twenty four times what they buy at 0.85. Same fifteen funds, same paperwork, same fees. Twenty four times the payoff, entirely because of a number the investor was never shown.
Look at the bottom row too. At 0.90, twenty funds and ten funds both round to 1.10. The count has stopped being an input at all.
This is twenty brochures wired to one engine
Here is where the counting exercise turns into something you can act on. Diversification is not a property of names, it is a property of return drivers. Two funds holding a different arrangement of the same large cap universe are not two bets, they are one bet split across two folios and two expense ratios.
The diagram is unkind but it is accurate, and the number sitting under the box is the judgment: after twenty selection decisions, twenty KYC forms and six years of effort, the portfolio owns one driver and a rounding error. Contrast that with the arithmetic of two sleeves that genuinely do not move together. An equity sleeve and a duration sleeve, equal weight, correlation near zero, gives you 2.00 effective bets. Two holdings beat twenty. That comparison is the whole case for thinking in return drivers rather than product names.
MythEvery new fund in the pie chart adds another layer of safety.
FactA new fund adds safety only if it moves differently from what you already own. Fifteen more funds at 0.85 correlation move the bets number from 1.14 to 1.17.
There is a floor, and he is already sitting on it
The bets number has a mirror image in volatility, which is where this stops being abstract. Portfolio standard deviation, expressed as a fraction of a single fund's, comes to 0.9381 at five funds and 0.9260 at twenty, holding the correlation at 0.85. Fifteen funds bought a 1.2 percentage point reduction in wobble.
Now push the count to infinity. The variance collapses to rho itself, so the volatility floor is the square root of 0.85, which is 92.20 percent of one fund's volatility. Adding funds cannot get you below it. Not at a hundred funds, not at a thousand.
He is at 92.60. The floor is 92.20. Every remaining fund in the universe of Indian equity schemes, added all at once, is competing for the last 0.40 of a percentage point. I do not think there is a cleaner way to say that the marginal fund is not a risk decision, it is an admin decision.
The floor in rupees
Percentages of a percentage are easy to wave away, so put money on it. Say an investor has Rs 20,00,000 spread evenly, and assume each fund swings about 15 percent in a typical year, which is an assumption for the example, not a figure for any scheme. One standard deviation year on a single fund is then a swing of Rs 3,00,000.
one fund: a typical yearly swing
Worked example, 15% assumed volatility
five funds at 0.85 correlation
Worked example
twenty funds at 0.85 correlation
Worked example
the floor: any number of funds
Worked example, square root of 0.85
Fifteen extra funds took about Rs 3,600 off a typical bad year on Rs 20 lakh. Every remaining scheme in the country could take off only another Rs 1,200 or so.
Why the correlation sits so high in India
Part of the reason is the rulebook. Under the SEBI scheme categorisation rules, first set on 6 Oct 2017 and restated in the circular of 26 Feb 2026, a large cap fund must keep at least 80 percent of its equity in large cap stocks, and large cap means the top 100 companies by full market capitalisation. Two funds that must both hold mostly the same 100 stocks cannot drift far apart. The label on the scheme tells you which pool it fishes in, and many of the twenty fish in the same pool. The free Learn module on modern portfolio theory shows how correlation, not count, sets the risk of the whole, and the risk you get paid for note covers which drivers are worth holding at all.
What happens when everybody counts names instead
The behaviour this produces is predictable and I have watched it play out in a dozen portfolios. An investor feels uneasy after a bad quarter, so he adds a fund. The unease is real, the action is real, the effect on risk is a rounding error. Next quarter, another fund. The portfolio grows names the way a garage grows boxes.
Then the second-order effect kicks in, and this one is worse. When enough people hold the same overlapping set, redemptions start arriving together. Panicked money leaves twenty schemes at once, the schemes sell the same underlying stocks into the same order book, and realised correlation rises exactly when you needed it to fall. The rho in the formula is not a constant. It drifts up in stress, which pushes the twenty-fund portfolio further down the table, at the only moment its owner is actually watching.
So the twenty-fund investor is not merely paying for diversification he does not have. He is running a structure whose one weakness gets worse in a crisis. That is a different and more uncomfortable problem than an inefficient fee stack, and it is why I now treat how sleeves are combined as a more serious question than which scheme sits inside each one.
Where this argument falls apart
Three honest limits, and the first one matters most.
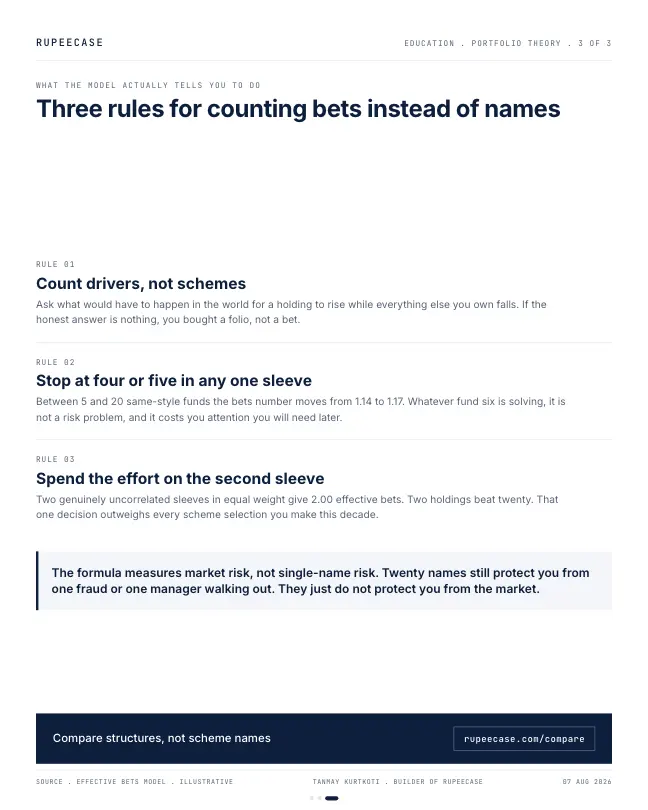
The formula measures market risk. It says nothing about single-name risk, and that is exactly where twenty names earn their keep. If one company in one scheme turns out to be a fraud, or one fund manager walks out and the process leaves with him, the investor holding twenty schemes takes a scratch where the investor holding one takes a wound. That protection is real at a correlation of 0.85 and the effective bets number will never show it. Anyone whose main fear is a blow-up in a single holding should keep the names and ignore this article.
Second, correlation is not a constant and it is not identical across every pair. I ran a single shared rho, which no real portfolio has. A genuine calculation uses the full covariance matrix and lands somewhere near this answer without matching it.
Third, the falsification test, and I will state it plainly. If Indian diversified equity funds actually ran pairwise correlations near 0.30 rather than in the high band, the twenty-fund portfolio would be defensible on this measure alone, because the table says twenty funds at 0.30 gives 2.99 bets. That is a real portfolio. My argument lives or dies on where the correlation truly sits, and that is a measurable thing, not an opinion.
Three rules I gave him
Count drivers, not schemes. Before adding anything, ask what would have to happen in the world for this holding to go up while everything else you own goes down. If the honest answer is nothing, you are buying a folio, not a bet.
- Name the driverWrite down what this holding earns from: Indian large caps, small caps, interest rates, gold.
- Check the overlapIf you already own that driver, the new name is a folio, not a bet.
- Ask the falling testWhat would make this rise while the rest falls? No answer means no new bet.
- Only then pick the schemeInside a driver, the cheaper and simpler option usually does the same job.
Stop at four or five inside any one sleeve. Between five and twenty large cap style funds the bets number moves from 1.14 to 1.17. Whatever problem you are solving with fund six, it is not a risk problem, and every extra name costs you attention you will need later.
Spend the effort on the second sleeve instead. Going from one driver to two genuinely different drivers takes you from about 1.17 bets to 2.00. That single decision beats every fund selection decision you will make this decade, which is why comparing structures rather than schemes is where the time belongs.
He wrote back an hour later asking whether he should sell fifteen of them. Not necessarily, and not in one afternoon, because exits carry tax and the funds are not bad, they are redundant. But he should stop buying the twenty-first.
The pie chart was never counting bets. It was counting colours.
Questions readers ask
How many mutual funds are enough for diversification?
On this model, once funds share a high correlation, the count barely matters: five funds at 0.85 give 1.14 effective bets and twenty give 1.17. What adds diversification is a holding with a different return driver, such as debt or gold next to equity. The right number depends on how many genuinely different drivers you want.
Does holding many equity funds reduce risk?
It reduces single name risk, because one bad stock or one fund manager matters less. It barely reduces market risk when the funds move together: at 0.85 correlation, volatility can never fall below about 92.2 percent of one fund's, however many you add.
The cards
3 cards. Swipe, or tap to open.
Explore next
Learn it properly, then see it applied.
Reading path
Stop 5 of 10 on Start here
Related
- Your biggest asset is not in your portfolioA 30 year old's future paycheques can be 15 to 20 times the brokerage account, so a portfolio should diversify away from the job, not toward it.Portfolio construction . . 5 min
- The risk you get paid forAbout 80 percent of a single stock's volatility is company specific and unrewarded, and an equal weight basket sheds it from 40 percent at one name to about 19 at thirty.Portfolio construction . . 5 min
- Single stock skew: own the haystackBessembinder found 57 percent of US stocks since 1926 did worse than a Treasury bill and four percent of names created all the net wealth.Portfolio construction . . 6 min
Educational content only. Figures are illustrative and computed on historical or representative data for teaching purposes, not investment advice. Past performance does not guarantee future returns. Sourced from NSE, BSE, SEBI, AMFI and RBI public data.