

Portfolio construction..5 min read
The cash dial, not the stock list
Risk appetite picks how much of the highest Sharpe portfolio to hold, not which stocks; swapping to a defensive basket instead costs about Rs 7.8 lakh on Rs 10 lakh over twenty years.
By Tanmay Kurtkoti, founder of QC Alpha and builder of RupeeCase
A friend asked me last week which stocks the "conservative" version of his portfolio should hold. Safer names, he assumed. Lower beta. Fewer late nights.
I told him he was reaching for the wrong knob, and he did not believe me until I drew it out.
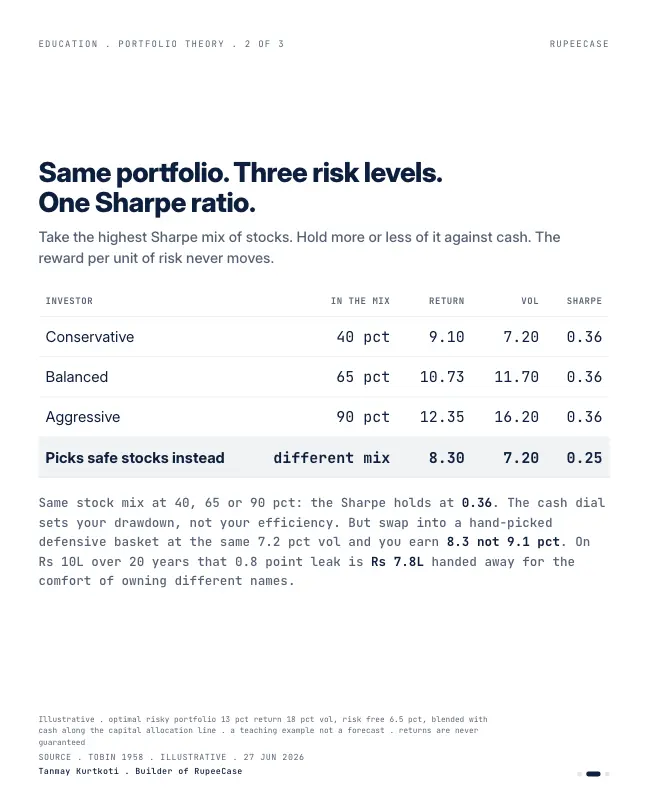
Start with one idea. Somewhere out there is a single mix of stocks that gives the most return for each unit of risk you take. The highest Sharpe portfolio. Now do something simple with it. Hold 40 pct of it and keep 60 pct in cash. Then try 65 pct. Then 90. The expected return climbs, the volatility climbs with it, and the one thing that never budges is the reward per unit of risk. In my illustrative numbers it sits at 0.36 the entire way along.
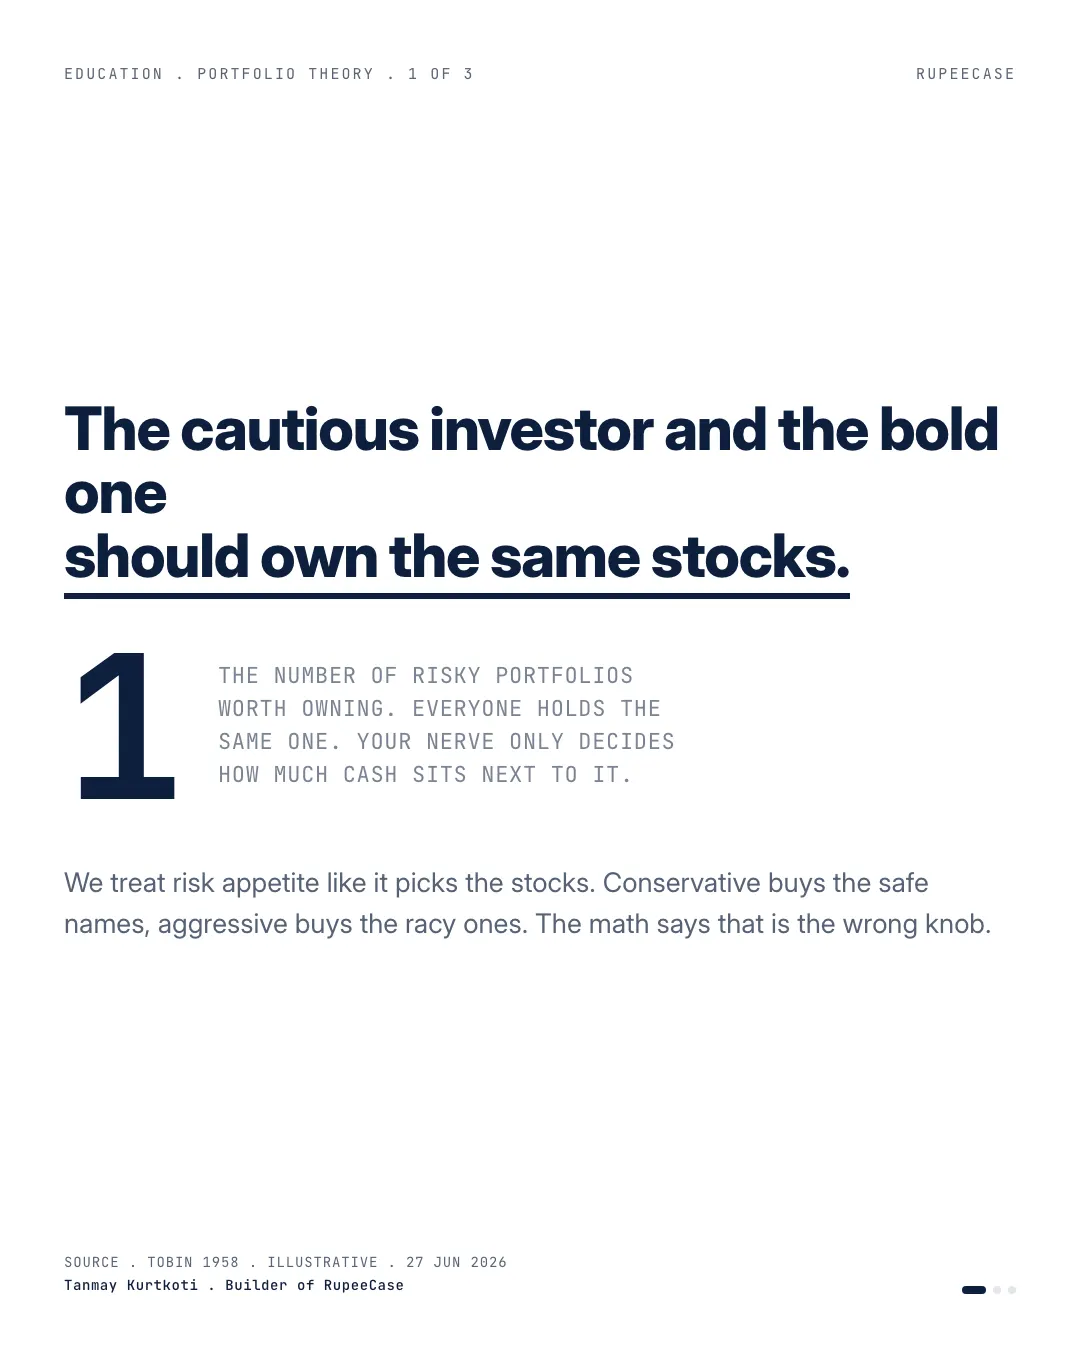
That is the whole trick. Your risk appetite does not pick the stocks. It picks how much of the same portfolio you can stomach holding. The cautious investor and the aggressive one should own the identical names. One just keeps more cash beside them.
Here is what it costs to ignore that. Take the cautious investor and let her do what feels natural, swap the racy names out for a hand-picked defensive basket at the same 7.2 pct volatility. She earns 8.3 percent instead of 9.1. That 0.8 point gap does not sound like much. On Rs 10 lakh over twenty years it is roughly Rs 7.8 lakh, handed away for the comfort of owning different stocks instead of less of the right ones.
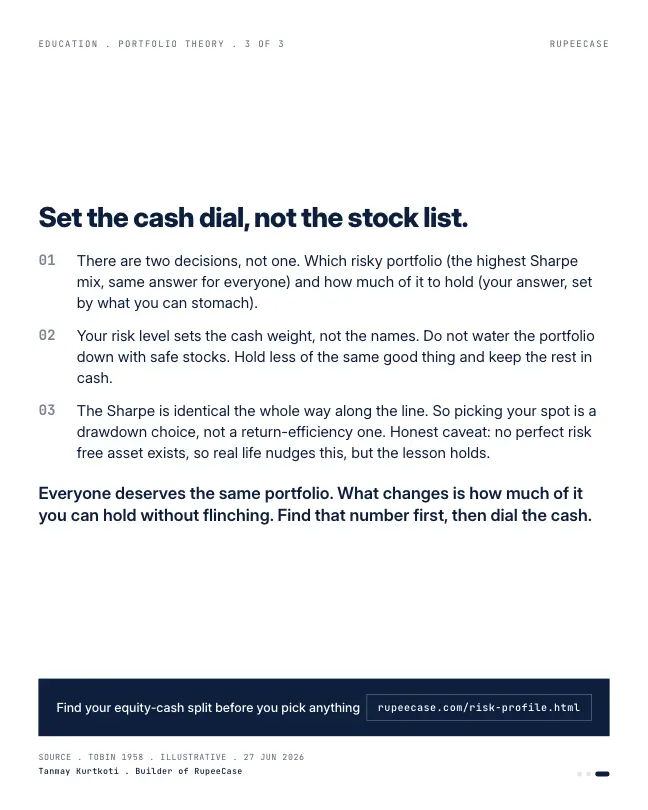
So there were never three portfolios for three risk levels. There was one portfolio and three settings on a cash dial. Honest caveat, the textbook version assumes a perfect risk free asset that does not quite exist, so real life nudges the edges. The lesson survives it.
Find the amount you can actually hold through a bad year first. Then dial the cash to match. The stocks were never the variable
Turning the dial
The dial needs two inputs from the real world. The first is the risk free rate. On 7 Oct 2026 the 91 day treasury bill cut off at an implied yield of 5.5747 percent in the RBI auction, so take the cash side at about 5.57 percent. The second is the risky portfolio itself. As an illustration, give it an expected 11 percent with 15 percent volatility. Its Sharpe ratio is (11 minus 5.57) divided by 15, about 0.36.
Try 65 and 90. Return rises to 9.1 and 10.5 percent, volatility to 9.75 and 13.5 percent, and the Sharpe ratio reads 0.36 every time. Mixing in cash scales both the reward and the risk by the same factor, so their ratio cannot change. Only a different risky portfolio can change it, and that is the point: the risky portfolio should be the best one you can find, and the dial does the rest.
The same engine, three settings
RupeeCase happens to run something close to this on one engine. Allcap holds 50 stocks from the Nifty Total Market. TotalMarket Hybrid runs the same 50 stock engine with 20 percent in debt. Allcap Multi Asset runs it with 10 percent debt and 10 percent gold. The names in the equity sleeve come from the same rules. Only the setting beside them changes.
Allcap Sharpe ratio, all equity
Model, back tested, as of 27 Apr 2026
TotalMarket Hybrid Sharpe, 20% debt
Model, back tested, as of 27 Apr 2026
Allcap Multi Asset Sharpe, debt and gold
Model, back tested, as of 27 Apr 2026
The CAGR moves the way the dial predicts: 44.70 percent for Allcap, 39.53 for TotalMarket Hybrid and 40.47 for Allcap Multi Asset (Model, back tested, as of 27 Apr 2026). The return per unit of risk stays in a narrow band, and edges up where the second sleeve is a genuine diversifier. This is not the textbook experiment, since the debt and gold sleeves are not risk free cash. It does show the shape: same names, different setting, similar efficiency.
Changing the names instead
A defensive basket at 7.2% volatility
- Earns 8.3% a year in the illustration
- Rs 10 lakh grows to about Rs 49.3 lakh in 20 years
- Gives up efficiency for comfort
Less of the best portfolio, same 7.2%
- Earns 9.1% a year in the illustration
- Rs 10 lakh grows to about Rs 57.1 lakh in 20 years
- Keeps the same reward per unit of risk
The gap is Rs 7.8 lakh: 1.091 to the power 20 is about 5.71, and 1.083 to the power 20 is about 4.93. Same volatility, same investor, a different knob.
Setting your own dial
- Pick the risky engine on qualityChoose it for return per unit of risk and for rules you trust, not for how calm it feels.
- Find the fall you can holdWrite down the worst drop in rupees you would sit through without selling.
- Set the dial to matchIf the engine can fall 25% and you can hold 10%, hold about 40% in it and the rest in debt or cash.
- Revisit the dial, not the namesWhen your life changes, move the setting. Leave the engine alone.
The free Learn module on modern portfolio theory covers the capital market line and the separation idea with a quiz and a certificate. The asset allocation calculator gives a starting setting from your horizon. For the bigger picture on the split, read the split decides more than the pick.
Questions readers ask
What is two fund separation?
It is the idea that every investor can hold the same best risky portfolio and a risk free asset, and choose only how much of each. Risk appetite sets the mix between the two, not the stocks inside the risky part.
Should a conservative investor buy safer stocks?
The theory says a conservative investor gives up less by holding less of an efficient portfolio than by switching to a different, less efficient one. In the illustration, the same 7.2 percent volatility earned 9.1 percent through the dial and 8.3 percent through a defensive basket.
What is the Sharpe ratio?
It is the return above the risk free rate divided by volatility. With a risk free rate of 5.57 percent, a portfolio expected to earn 11 percent with 15 percent volatility has a Sharpe ratio of about 0.36.
The cards
3 cards. Swipe, or tap to open.
Explore next
Learn it properly, then see it applied.
Related
- The split decides more than the pickBrinson's finding is about variability, not return, and holding the same index at 100/0/0 versus 40/40/20 trades two points of return for 34 points of drawdown.Portfolio construction . . 5 min
- The mix beats the pickBrinson's 90 percent is about variability over time, not return; the same index at 100/0/0 and 40/40/20 trades 2.2 points of return for a worst drop of 28 instead of 52.Portfolio construction . . 11 min
- The calm day contractThe same investor scored Moderately Aggressive on a quiet day and Conservative three weeks into a wobble, so fill the profile on a boring day and treat it as a contract.Portfolio construction . . 5 min
Educational content only. Figures are illustrative and computed on historical or representative data for teaching purposes, not investment advice. Past performance does not guarantee future returns. Sourced from NSE, BSE, SEBI, AMFI and RBI public data.