

Portfolio construction..5 min read
The conservative starter is a drawdown number, not a name
Most investors tick the box for a 40 percent drawdown and panic at 15 to 20, which is why the first SIP should be sized to the worst window you would keep adding into.
By Tanmay Kurtkoti, founder of QC Alpha and builder of RupeeCase
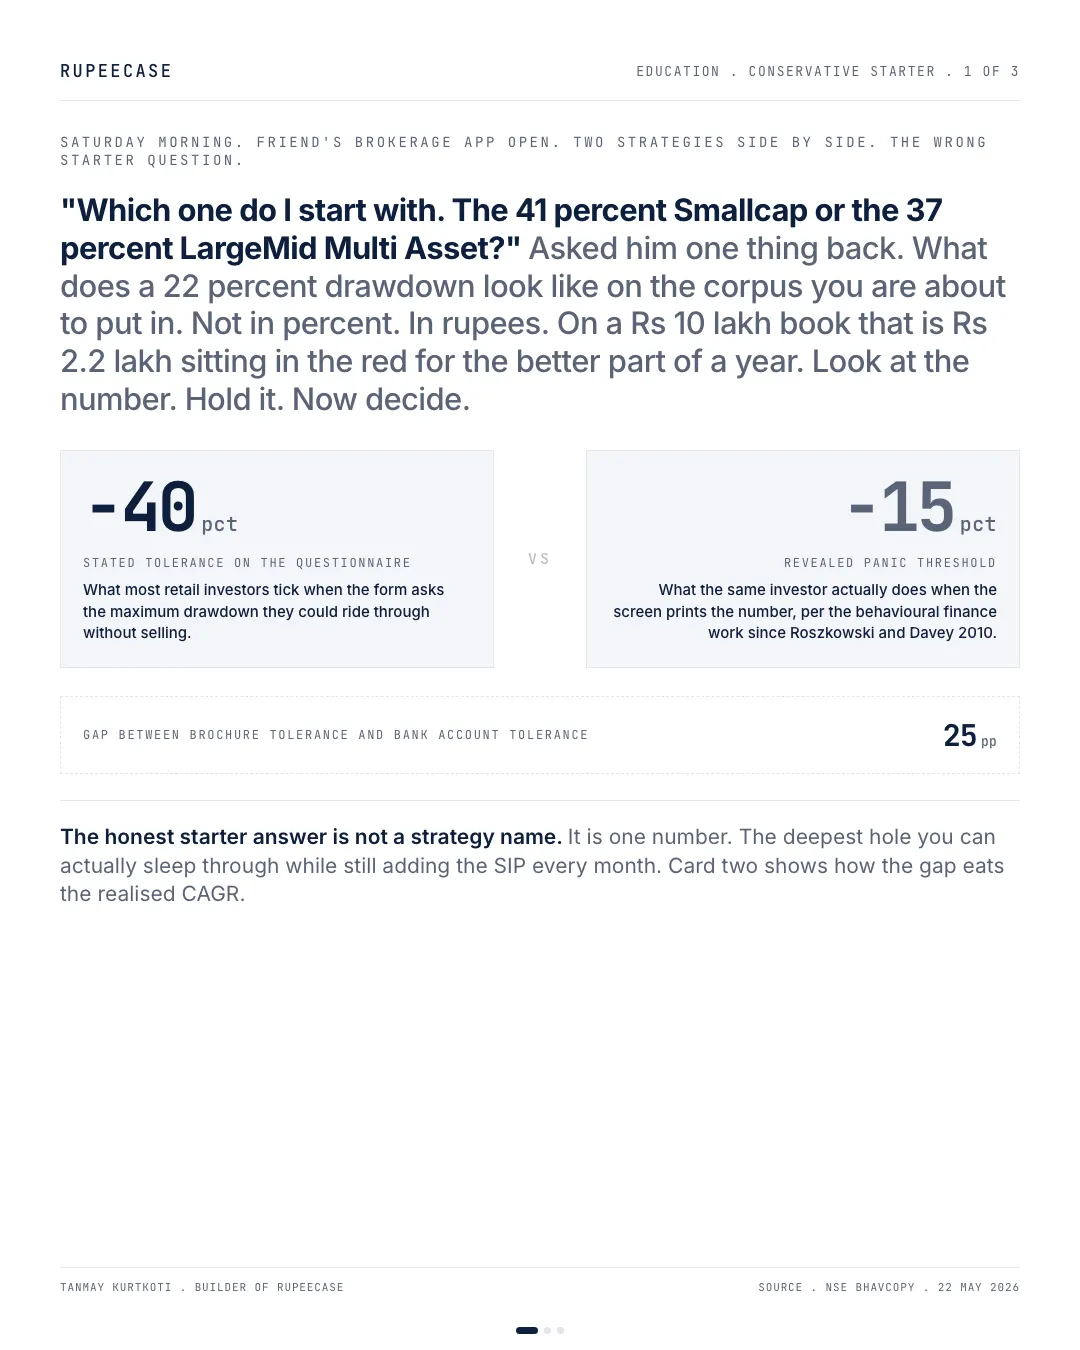
Saturday morning. Friend's brokerage app open. Two strategies side by side. The one above reads 41 percent CAGR five year. The one below reads 37. He asks "which one do I start with."
Asked him one thing back. What does a 22 percent drawdown look like on the corpus you are about to put in. Not in percent. In rupees. On a Rs 10 lakh book that is Rs 2.2 lakh sitting in the red for the better part of a year. Look at the number. Hold it. Now decide.
The honest starter answer is not a strategy name. It is one number. The deepest hole you can actually sleep through while still adding the SIP every month.
The literature on this is uncomfortable. On the same form most retail investors tick the box that says they can ride a 40 percent drawdown without selling. The behavioural finance work since Roszkowski and Davey 2010 puts the revealed panic threshold at minus 15 to minus 20 percent. A 25 percentage point gap between the brochure tolerance and the bank account tolerance. The five slider risk quiz that flatters everyone into Moderate exists to ignore the gap. Almost no one is Moderate.
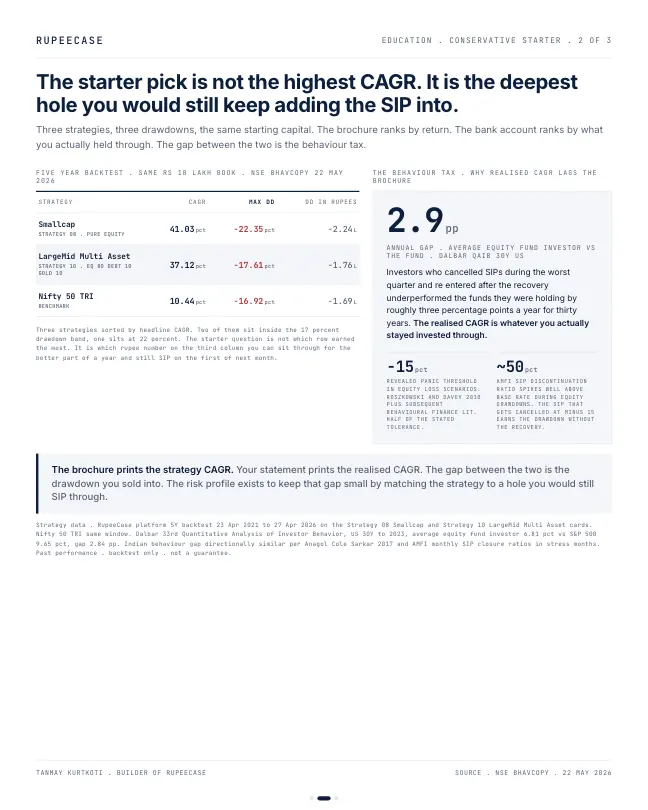
That gap shows up on the statement. A long running US study of investor behaviour put the average equity fund investor at 6.81 percent a year over thirty years, against 9.65 percent for the broad US market index. A 2.9 percentage point annual leak, every year, for thirty years. Indian work since Anagol Cole Sarkar 2017 is directionally similar. The mechanism is simple. The SIP cancelled at minus 15 earns the drawdown and misses the recovery. The realised CAGR is whatever you actually stayed invested through.
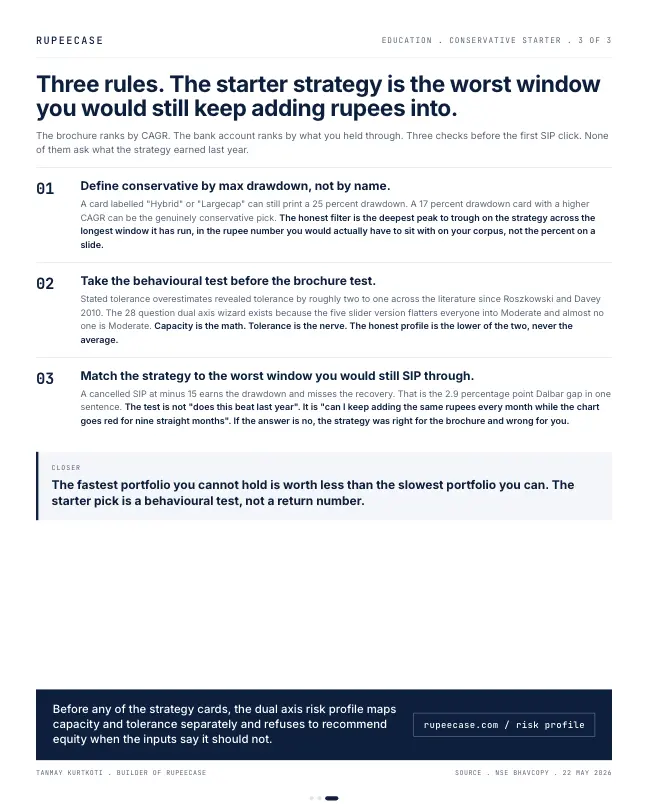
Three checks before the first SIP click. Define conservative by max drawdown, not by name. Take the behavioural test before the brochure test, because capacity is the math and tolerance is the nerve and the honest profile is the lower of the two. Match the strategy to the worst window you would still keep adding rupees into. If the answer is no the screen was right and the strategy was still wrong for you.
The fastest portfolio you cannot hold is worth less than the slowest portfolio you can.
The minus 15 to 20 zone is not rare
A panic line at 15 to 20 percent would matter less if markets seldom got there. They get there often, and not only in small caps. Here are three falls on NSE indices in the last two years, each from the index's record close to its lowest close after it.
- Nifty 50, Sep 24 to Mar 25-15.77%
- Midcap 150, Sep 24 to Feb 25-21.09%
- Smallcap 250, Sep 24 to Mar 25-26.14%
NSE closing values (NSE bhavcopy index history), record close to low: Nifty 50 26,216.05 on 26 Sep 2024 to 22,082.65 on 4 Mar 2025; Nifty Midcap 150 22,493.50 on 24 Sep 2024 to 17,750.55 on 28 Feb 2025; Nifty Smallcap 250 18,623.15 on 23 Sep 2024 to 13,755.90 on 3 Mar 2025.
Strategies sit in the same zone. The deepest fall on the RupeeCase Large Mid Multi Asset card was 17.60 percent and on the Allcap card 22.72 percent (Model, back tested, as of 27 Apr 2026). Every equity heavy option on any shelf will visit this zone at some point.
The fall is quick. The wait is the hard part. Each of those indices took far longer to recover than to drop.
- All three near their lows
Nifty 50 down 15.8 percent, Midcap 150 down 21.1, Smallcap 250 down 26.1 from their records.
- Nifty 50 and Midcap 150 back above their records
First closes above 26,216.05 and 22,493.50, 463 and 465 days after the records.
- Smallcap 250 within 0.5 percent
18,527.20, its nearest close to the record of 18,623.15 since the 2025 low. It does not cross.
- Smallcap 250 still below its record
17,772.80, 4.6 percent under it, 749 days after the record.
An investor who stopped the SIP at minus 15 in any of these locked in a loss and then had to decide, without any signal, when to start again. Most do not restart near the bottom. That is the leak the opening describes.
Size the first SIP to a rupee number
The cleanest way to choose a starting amount is to write down the fall you would keep investing through, in rupees, and work backwards.
When the loss on screen equals 11 months of savings, many investors feel the last year of SIPs has been wiped out. If that number is unbearable, the honest answer is a strategy or mix with a smaller worst fall, chosen today, on a calm day.
What would you do?
What would you do?
It is 30 Mar 2026. The Nifty 50 closed at 22,331.40, down 14.5 percent from 26,129.60 on 31 Dec 2025. Your SIP is due tomorrow.
- Pause the SIP until things calm down
On 30 Apr 2026 the Nifty 50 closed at 23,997.55, about 7.5 percent above the 30 Mar close. The paused month missed that rise.
- Let the SIP run as planned
The instalment bought units at the 30 Mar level. A month later the index was about 7.5 percent higher.
NSE, Nifty 50 closes (NSE bhavcopy index history): 26,129.60 on 31 Dec 2025, 22,331.40 on 30 Mar 2026, 23,997.55 on 30 Apr 2026. Past moves, not a promise.
One month proves nothing on its own; the index fell again later in 2026. The point is narrower. A plan that runs through the red months buys at those prices. A plan that pauses does not.
The free Learn module on loss aversion and prospect theory explains why a loss feels about twice as heavy as an equal gain, and how rules protect you from that wiring. The SIP calculator shows what steady instalments compound to. For the two axis method, read the lower number is your profile.
Questions readers ask
Should I stop my SIP when the market falls?
That is a personal decision, but the arithmetic is clear: a paused SIP skips the instalments bought at lower prices. On 30 Mar 2026 the Nifty 50 was 14.5 percent below its Dec 2025 close, and a month later it was about 7.5 percent above the 30 Mar level.
What does a conservative investor mean in mutual funds?
A useful definition is a maximum drawdown you can live through, in rupees, rather than a label. If you would stop investing after a 15 percent fall, a conservative mix is one whose worst historical fall sits near or below that.
How long does the market take to recover from a fall?
It varies a lot. On NSE data, the Nifty 50 took 463 days to close above its Sep 2024 record after a 15.8 percent fall and the Nifty Midcap 150 took 465 days after a 21.1 percent fall. The Nifty Smallcap 250 fell 26.1 percent from its record and had still not closed above it on 12 Oct 2026, 749 days later.
The cards
3 cards. Swipe, or tap to open.
Explore next
Learn it properly, then see it applied.
Related
- Risk profile fit: the drawdown you can actually sit throughMax drawdowns across the RupeeCase shelf ran from 16.92 to 39.48 percent when this was written, and SEBI's two axis rule makes your honest profile the lower of capacity and tolerance.Portfolio construction . . 5 min
- The lower number is your profileA real risk profile scores willingness and capacity separately out of 50 and takes the lower one, which is how a self declared daredevil with an eight month horizon ends up conservative.Portfolio construction . . 5 min
- The calm day contractThe same investor scored Moderately Aggressive on a quiet day and Conservative three weeks into a wobble, so fill the profile on a boring day and treat it as a contract.Portfolio construction . . 5 min
Educational content only. Figures are illustrative and computed on historical or representative data for teaching purposes, not investment advice. Past performance does not guarantee future returns. Sourced from NSE, BSE, SEBI, AMFI and RBI public data.