

Portfolio construction..5 min read
The calm day contract
The same investor scored Moderately Aggressive on a quiet day and Conservative three weeks into a wobble, so fill the profile on a boring day and treat it as a contract.
By Tanmay Kurtkoti, founder of QC Alpha and builder of RupeeCase
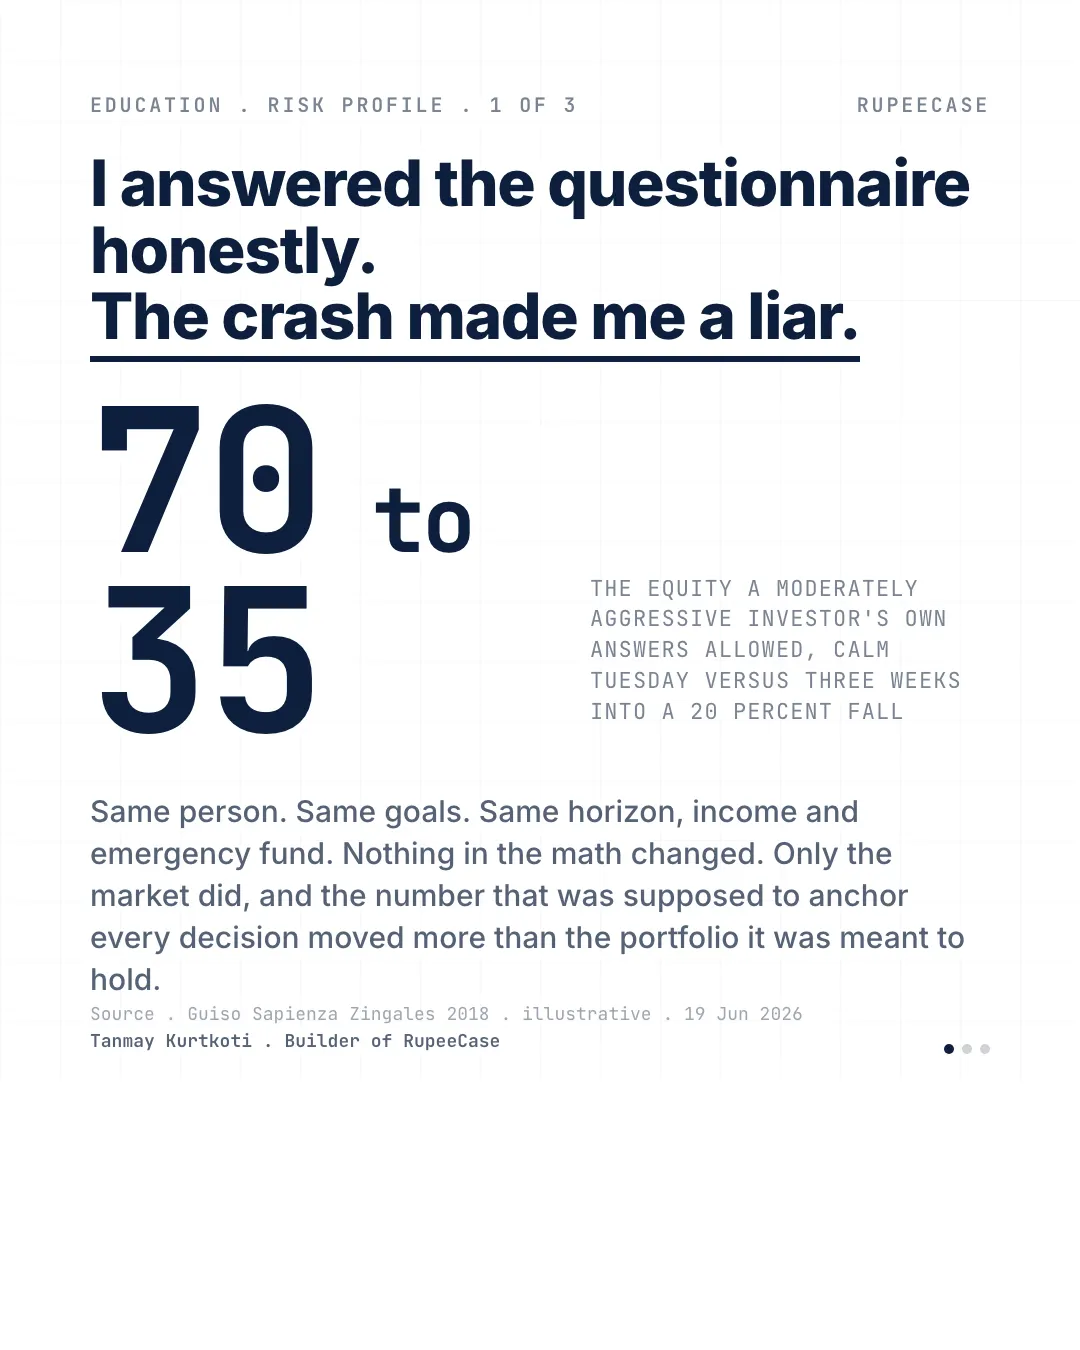
A friend filled out a risk questionnaire last year. Picked Moderately Aggressive without much hesitation. Said he was fine holding 70 percent in equity, fine riding the swings.
Three weeks into the spring wobble I sat with him while he filled out the same form again. Same job. Same salary. Same goals, same horizon, same emergency fund sitting untouched in the same account. The questionnaire scored him Conservative. Thirty-five percent equity, tops.
Nothing about his actual situation had changed. The only thing that moved was the market, and the number that was supposed to anchor every decision he made moved further than the portfolio it was meant to hold.
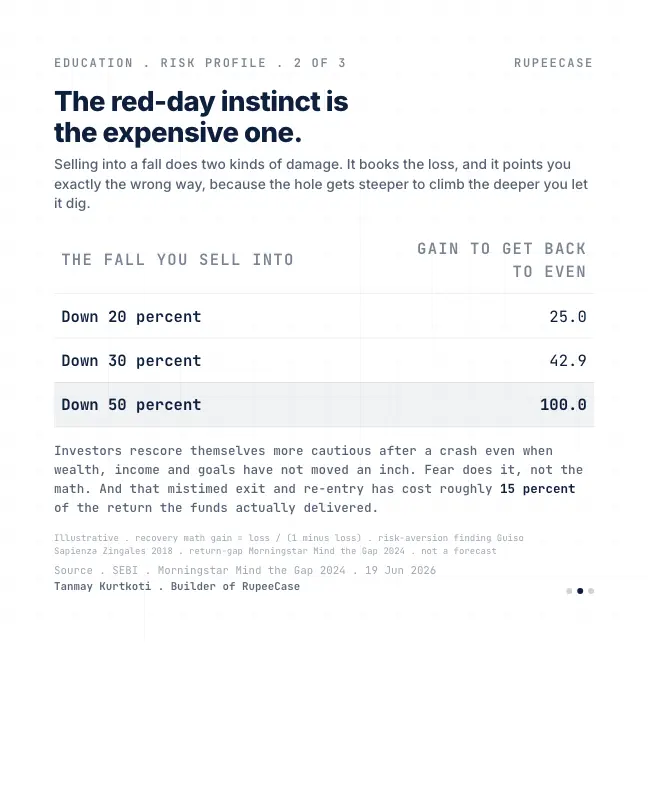
He is not unusual. There is a well-known study on exactly this. After the 2008 crash, investors rescored themselves dramatically more risk-averse, and the researchers could not explain it with changes in wealth or income. What they were left with was fear. Risk tolerance, the thing we treat as a stable personal trait, turns out to bend with the last few weeks of the screen.
The expensive part is that the red-day instinct points the wrong way. Selling into a 20 percent fall books the loss and hands you a steeper climb back, because a 20 percent fall needs a 25 percent gain to recover, a 30 needs 43, a 50 needs a full 100. Mistimed exits and re-entries like this have cost investors roughly 15 percent of the return the funds underneath them actually delivered.
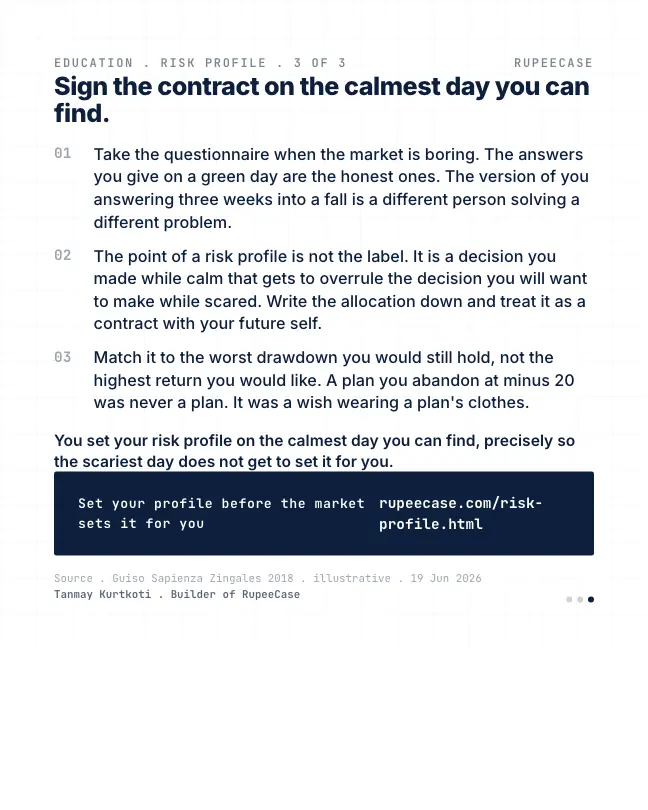
So here is what I told him. Fill out the profile on the most boring market day you can find. The calm answers are the honest ones. Then write the allocation down and treat it as a contract, a decision you made while clear-headed that gets to overrule the one you will want to make while scared.
You set your risk profile on the calmest day you can find, precisely so the scariest day does not get to set it for you:
What a scary few weeks looks like in data
The last real test of this was not long ago. Between 31 Dec 2025 and 30 Mar 2026 the Nifty 50 fell from 26,129.60 to 22,331.40, a drop of 14.5 percent, by NSE closing data. Inside that stretch were three of the five worst single days of the past two years: minus 3.26 percent on 19 Mar 2026, minus 2.60 percent on 23 Mar and minus 2.14 percent on 30 Mar.
Nifty 50 fall, 31 Dec 2025 to 30 Mar 2026
NSE closes
Of the five worst days in two years, all in March 2026
NSE daily closes, 14 Oct 2024 to 9 Oct 2026
Rise from 30 Mar to 30 Apr 2026
NSE closes, 22,331.40 to 23,997.55
A questionnaire filled on 30 Mar 2026 would have been filled at the end of a run of the worst days in two years. That is precisely the answer recency bias produces: the last three weeks standing in for the next ten years. A month later the index was 7.5 percent higher. It fell again later in the year, and nobody could have known either move in advance. The point is only that the scared answer described the screen, not the investor.
The climb back is not symmetric
The opening's recovery figures come from one formula. After a fall of d, the gain needed to get back is 1 divided by (1 minus d), minus 1.
- Fall of 10%11.1%
- Fall of 20%25.0%
- Fall of 30%42.9%
- Fall of 40%66.7%
- Fall of 50%100.0%
Gain needed to recover = 1 / (1 minus fall) minus 1. Arithmetic, not a forecast.
Selling at the bottom does not avoid that climb. It hands the climb to cash, which will not make it. The investor who sold at minus 30 and waits for calm usually buys back after a good part of the 42.9 percent has already happened.
How long the climb takes
At an assumed 12 percent a year, a 20 percent fall takes about two years to undo and a 40 percent fall about four and a half. These are the numbers to read on a calm day, so they are not a surprise on a scary one.
Writing the contract
- Fill the profile on a dull dayNo big move in the past month, no headline you checked twice.
- Write the split and the worst fallFor example: 70 percent equity, a fall of 25 percent expected at some point.
- Write the rule for red daysThe SIP continues; rebalance only on the set date or band.
- Review on life events, not market eventsA new job, a child, a goal date moved. Not a bad month.
The free Learn module on overconfidence, anchoring and recency bias explains why the last few weeks weigh so heavily on judgment, with examples and a quiz. The drawdown recovery calculator gives the climb back for any fall. For the two axis method behind a sound profile, read the lower number is your profile.
Questions readers ask
Does risk tolerance change with the market?
Measured tolerance does. Studies after the 2008 crash found investors scored themselves much more risk averse with no change in wealth or income. That is why a profile filled on a calm day, and treated as a commitment, is more reliable than one filled during a fall.
How much does the market need to rise to recover from a fall?
A 20 percent fall needs a 25 percent rise, a 30 percent fall needs 42.9 percent, and a 50 percent fall needs 100 percent. The gain is earned on a smaller base, so it is always larger than the fall.
When should I redo my risk profile?
When your life changes: a new job, a change in income, a new dependant, or a goal date that moves. A bad month in the market is not a reason, because the answers it produces reflect recent prices more than your actual situation.
The cards
3 cards. Swipe, or tap to open.
Related
- The lower number is your profileA real risk profile scores willingness and capacity separately out of 50 and takes the lower one, which is how a self declared daredevil with an eight month horizon ends up conservative.Portfolio construction . . 5 min
- A risk profile has an expiry dateTwo years from a college goal, a 35 percent crash leaves a 90 percent equity saver Rs 10 lakh short while one who glided to 25 percent equity lands funded.Portfolio construction . . 6 min
- Capacity, tolerance, need: the three risksA questionnaire scored one risk and pointed at 90 percent equity; capacity eight years from retirement and a need of about 9 percent a year both pointed near 60.Portfolio construction . . 4 min
Educational content only. Figures are illustrative and computed on historical or representative data for teaching purposes, not investment advice. Past performance does not guarantee future returns. Sourced from NSE, BSE, SEBI, AMFI and RBI public data.