

Portfolio construction..5 min read
How many stocks do you actually own
Seven mutual funds held 92 unique names, but the top ten carried 47 percent of the money and the long tail was too small to matter either way.
By Tanmay Kurtkoti, founder of QC Alpha and builder of RupeeCase
Friend showed me his portfolio over coffee last weekend. Seven mutual funds. He had been adding one a year for seven years. Said he was "well diversified."
I asked him how many stocks he actually owned. He did not know.
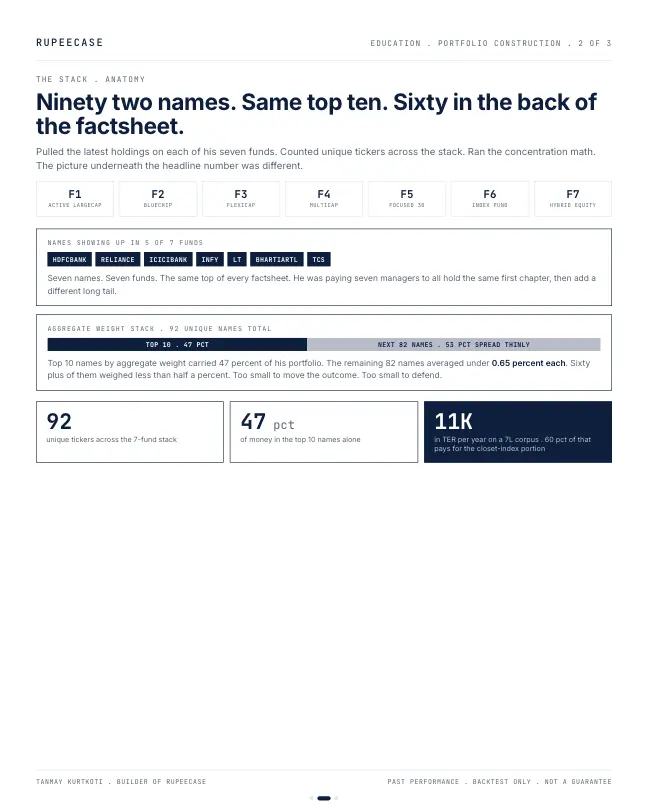
We pulled the latest holdings page for each of his seven funds and counted unique tickers across all of them. Ninety two names. He looked relieved. Then I ran him through the math behind diversification and his face changed.
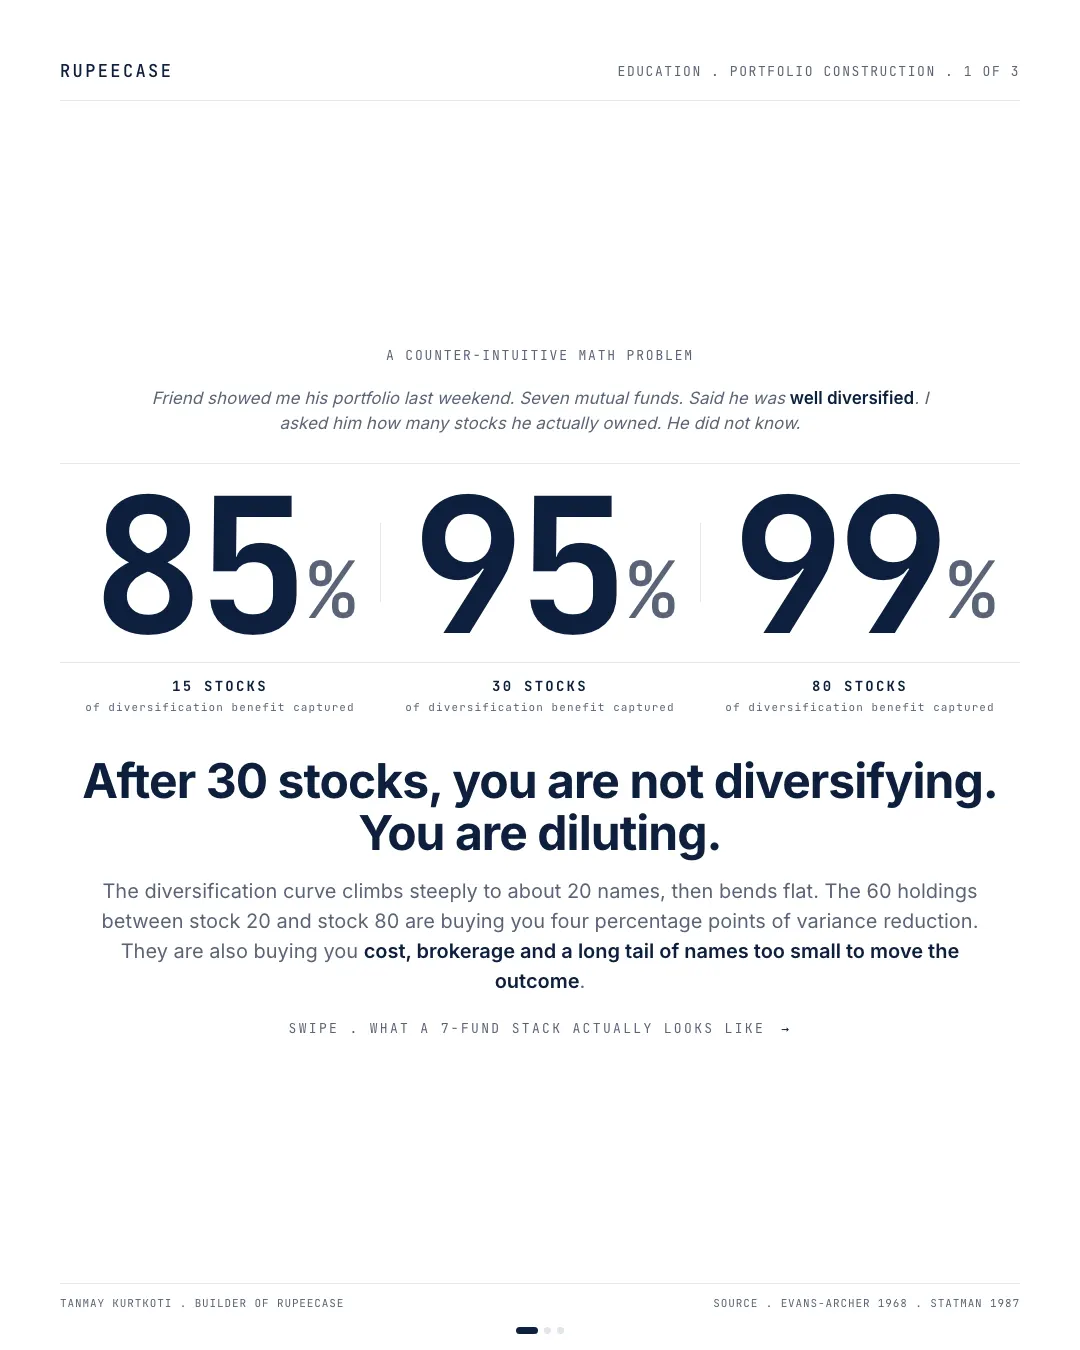
Evans and Archer ran the foundational study back in 1968. Statman refreshed it in 1987. Plenty of follow-up work since on Indian equities specifically. The curve has held up across markets and decades. Five stocks captures roughly 50 percent of the diversification benefit available in equities. Fifteen stocks captures 85 percent. Thirty captures 95. Eighty captures 99. The curve climbs steeply to about 20 stocks then bends flat. Every additional name past 30 buys you a fraction of a percent of variance reduction. Past 80 you are essentially flat. The math does not care whether the names got into the portfolio through direct purchase, a mutual fund, an ETF, or a model stock basket. The plain-English explainer on diversification and concentration math is at rupeecase.com/learn/
Now we ran it on his stack. Ninety two unique names looked great on paper. The arithmetic underneath looked different. Seven names showed up in five of his seven funds. HDFC Bank, Reliance, ICICI Bank, Infosys, Larsen and Toubro, Bharti Airtel, TCS. The top 10 by aggregate weight carried 47 percent of his portfolio. The bottom 60 plus holdings sat at less than half a percent each, scattered through the back of every factsheet, none of them big enough to move the outcome on the way up or defend the outcome on the way down.
He was not paying seven fund managers for diversification. He was paying seven fund managers to all hold the same top 10 names in slightly different slices and then add a long tail that the math says cannot move the needle. The 1.65 percent average TER on a 7 lakh corpus is roughly 11 thousand a year in fees. Sixty percent of that is paying for the closet-index portion of the stack . the part an index fund delivers for 0.20 percent.
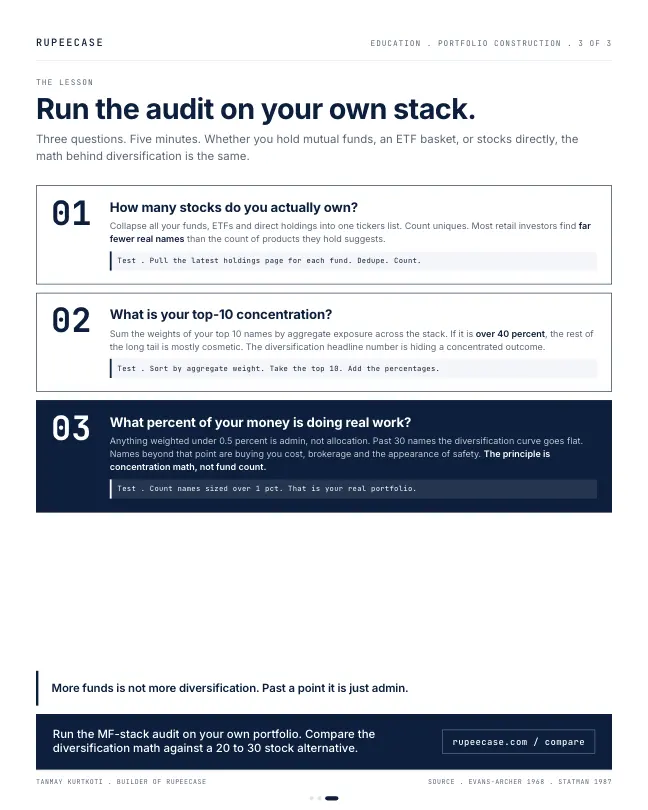
The honest audit is three questions. How many stocks do you actually own when you collapse the funds into one tickers list. What is your top-10 concentration as a percent of total. What percent of your money is doing real work versus paying for the appearance of safety.
More funds is not more diversification. Past a point it is just admin.
Why the curve bends flat
The flattening has a short formula behind it. Take a basket of N stocks at equal weight. If each stock swings about 40 percent a year on its own and the average pair of stocks moves together with a correlation of 0.20, the basket's volatility is 40 times the square root of (0.20 plus 0.80 divided by N).
Run it for a few sizes. One stock: 40 percent. Five stocks: 40 times the square root of 0.36, which is 24.0 percent. Fifteen: 20.1. Thirty: 19.0. Eighty: 18.3. An infinite number of stocks: 17.9. Past about 30 names you are fighting over the last single point.
- 1 stock40.0%
- 5 stocks24.0%
- 15 stocks20.1%
- 30 stocks19.0%
- 80 stocks18.3%
- No limit (market risk)17.9%
Equal weight basket volatility = 40% x square root of (0.20 + 0.80 / N). Illustration inputs: 40% single stock volatility, 0.20 average correlation.
The floor at 17.9 percent is the part no number of funds can remove. It is the market itself. The correlation term never goes away, so after the specific risk of each company is diluted, what remains is the risk that all of them share. Seven funds on the same market sit on the same floor.
The real count after overlap
The number that matters is not the unique ticker count. It is how much money sits in each name after you add every fund together. Here is a short audit you can do on a single sheet.
- List every holdingCopy each fund's latest monthly portfolio: stock name and weight in that fund.
- Weight by your moneyMultiply each weight by the rupees you hold in that fund. A 9% holding in a Rs 2 lakh fund is Rs 18,000.
- Add across fundsSum the rupees per stock. The same company in five funds becomes one line.
- Rank and read the top 10Divide the top 10 rupee total by your whole portfolio. Above half and the stack is concentrated.
In his case the answer was 47 percent in 10 names, with more than 60 names below half a percent each. At half a percent, a stock that doubles adds 0.5 percent to the whole portfolio. A stock that goes to zero takes away 0.5 percent. Neither changes the year.
What the overlap costs
The fees are the quiet part. If 60 percent of the stack behaves like the index, that portion could be held for a fraction of the cost. Put in your own figures.
On the opening figures, about Rs 6,090 a year goes to the part of the stack an index fund would deliver. That is on Rs 7 lakh. As the corpus grows, so does the gap, and it compounds the wrong way.
This is not a case against active funds. A fund that holds something genuinely different from the index is worth judging on what it adds. The point is narrower: seven funds that hold the same leaders are one portfolio with seven fee lines. The expense ratio calculator shows what a fee gap does over twenty years.
The free Learn module on modern portfolio theory covers the variance formula behind the curve above, and why correlation, not the count of holdings, sets the floor. For the other side of the same idea, read the skew behind single stocks.
Questions readers ask
How many stocks do I need to be diversified?
Most of the benefit arrives by 20 to 30 stocks held at sensible weights. In the illustration above, 30 stocks bring a 40 percent single stock swing down to about 19 percent, and adding 50 more only takes it to about 18.3. What matters more is that no single name or sector carries a large share.
Does holding many mutual funds reduce risk?
Only if the funds hold different things. Funds in the same category often share the same top holdings, so adding more mostly adds overlap and fees. Add up the rupees per stock across all funds to see the real concentration.
What is portfolio overlap in mutual funds?
Overlap is the share of your money that sits in the same stocks across different funds. High overlap means two funds behave almost like one, while you pay two expense ratios.
The cards
3 cards. Swipe, or tap to open.
Explore next
Learn it properly, then see it applied.
- StrategyAllcap strategyNifty Total Market, 50 stocks, every 2 weeks
- CalculatorAsset allocation by risk profileFree, with the formula and a worked example
- Free module 4.1Modern Portfolio Theory, What Actually Matters11 min read
- CalculatorExpense ratio impactFree, with the formula and a worked example
- Blog topicPortfolio construction notes33 notes
Related
- Single stock skew: own the haystackBessembinder found 57 percent of US stocks since 1926 did worse than a Treasury bill and four percent of names created all the net wealth.Portfolio construction . . 6 min
- The risk you get paid forAbout 80 percent of a single stock's volatility is company specific and unrewarded, and an equal weight basket sheds it from 40 percent at one name to about 19 at thirty.Portfolio construction . . 5 min
- Your biggest asset is not in your portfolioA 30 year old's future paycheques can be 15 to 20 times the brokerage account, so a portfolio should diversify away from the job, not toward it.Portfolio construction . . 5 min
Educational content only. Figures are illustrative and computed on historical or representative data for teaching purposes, not investment advice. Past performance does not guarantee future returns. Sourced from NSE, BSE, SEBI, AMFI and RBI public data.