

Factors..5 min read
The size myth on our own shelf
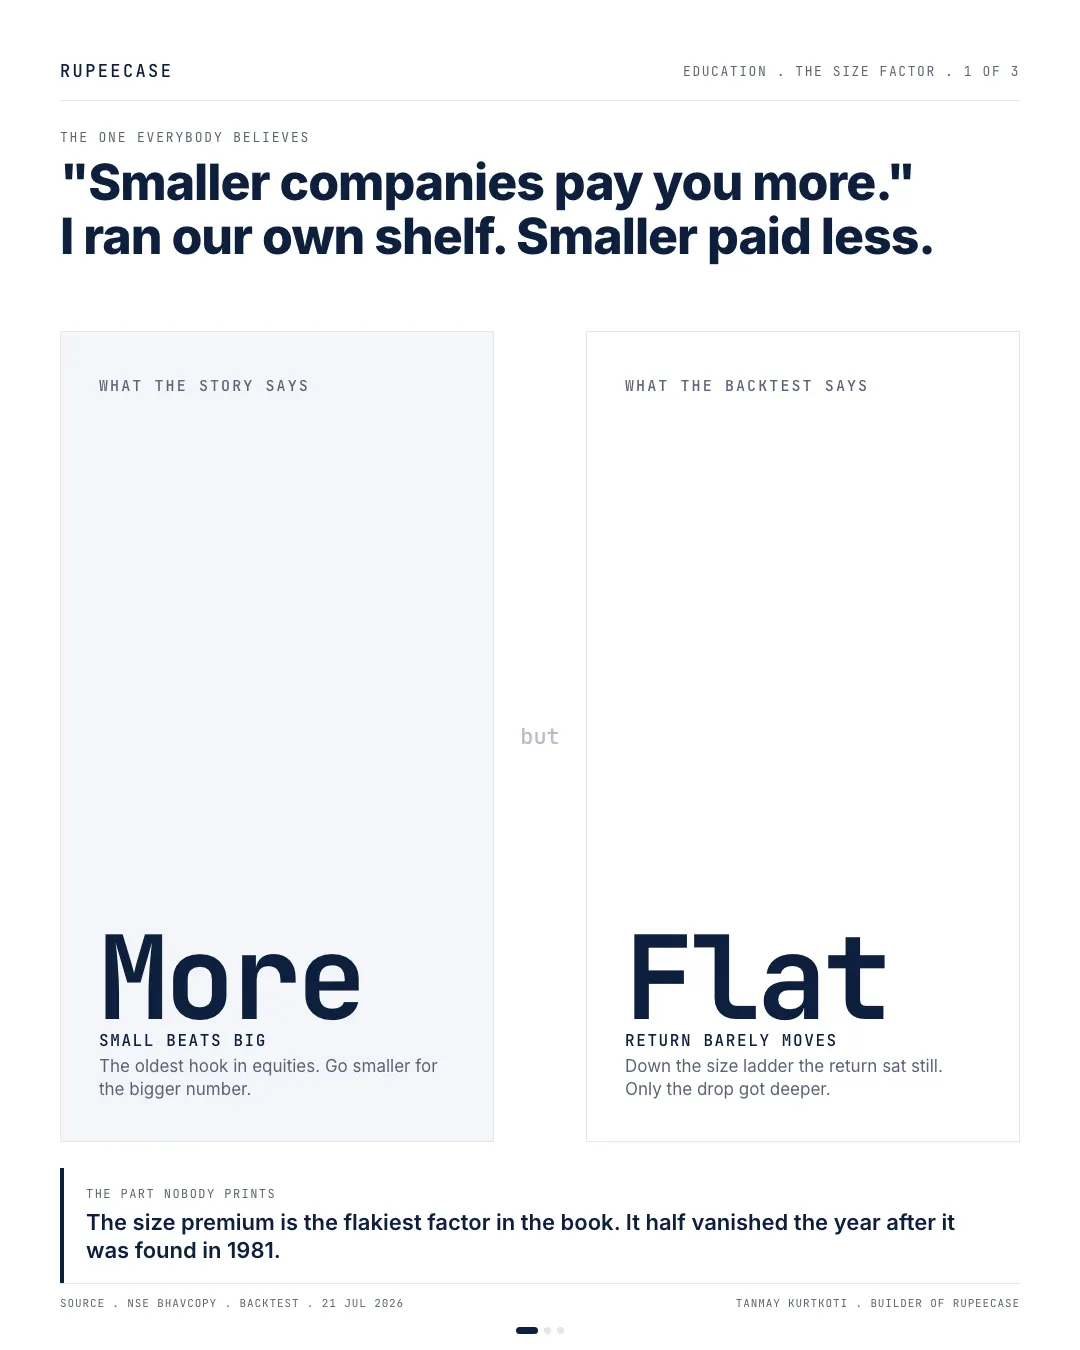
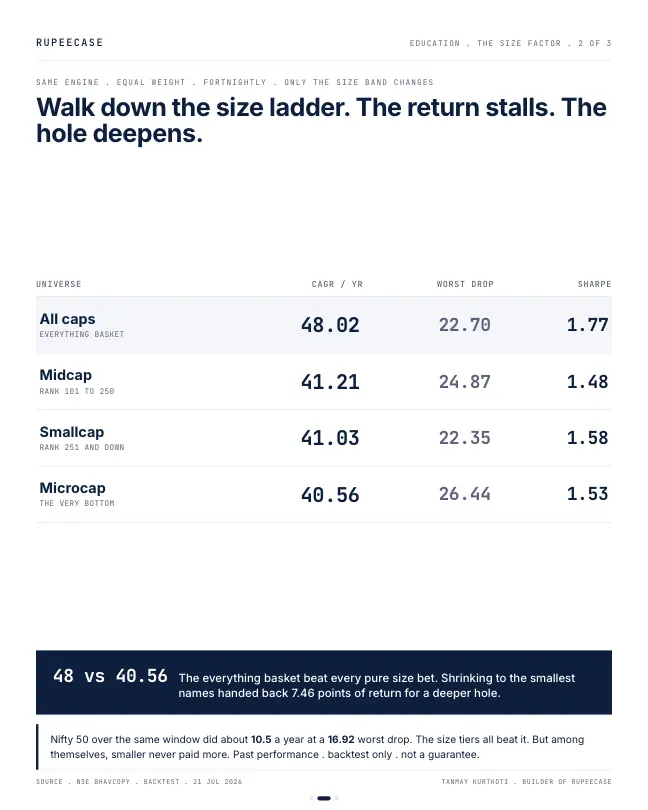
Midcap, Smallcap and Microcap printed 41.21, 41.03 and 40.56 percent while the Allcap basket did 48.02 with a similar worst drop, so small on its own is not an edge.
Model, back tested, as of 27 Apr 2026, as published then; the strategy page shows the current figure.
By Tanmay Kurtkoti, founder of QC Alpha and builder of RupeeCase
Everyone hears the same line when they start out. Smaller companies pay you more, so go down the cap ladder for the bigger number. It sounds like a law of nature. I decided to run it on our own shelf instead of trusting the folklore.
Four tiers, same backtest engine, equal weight, same fortnightly rebalance. The only thing changing was the size band.
The bigger number never turned up. Midcap did 41.21 a year. Smallcap 41.03. Microcap, scraping the very bottom, 40.56. That is the whole return ladder, and it is flat. If anything it tilts down as you shrink.
Then look at what it cost you to stand on each rung. The worst drop went 24.87, then 22.35, then 26.44. Microcap dug the deepest hole of the lot for the smallest payout. Depth is not a return promise. It is just depth.
The line that actually stung was the comparison nobody frames this way. The everything-basket, all caps mixed together, did 48.02 a year with a worst drop in line with the pure size tiers and the best Sharpe of the group. Concentrating into "small" handed back roughly seven points of return. The diversification you were told to skip was the part that paid.
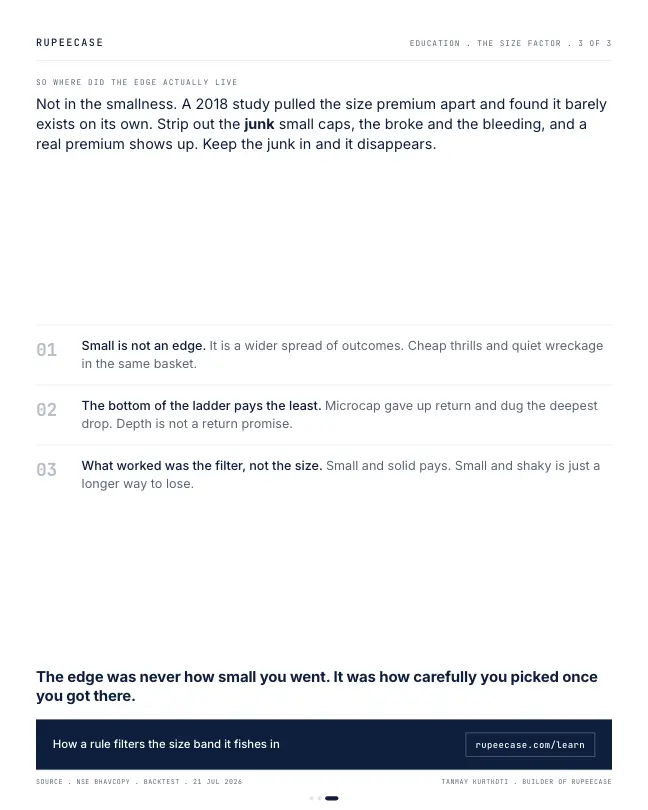
None of this means small caps are bad. It means "small" on its own is not an edge. The size premium is the flakiest factor in the book. Banz found it in 1981 and it began fading almost the year it was published. A 2018 study pulled it apart and found the honest version. Strip out the junk, the broke and the bleeding tiny names, and a real premium shows up. Leave the junk in and it disappears.
So the edge was never how small you went. It was how carefully you picked once you got there.
Past performance is backtest only and not a guarantee.
The ladder on the current figures
The figures in the opening are as published in July. The model lineup has been refreshed since. On the current figures the ladder is still flat, and the all cap basket is still on top.
- Allcap44.70%
- Midcap38.75%
- Smallcap37.40%
- Microcap37.33%
CAGR. Model, back tested, as of 27 Apr 2026. RupeeCase lineup.json. Not client returns and not a promise of future returns.
The pattern holds: midcap 38.75, smallcap 37.40, microcap 37.33, a ladder that tilts down as the companies shrink. Allcap sits about six to seven points above all three. Allcap's worst fall, 22.72 percent, sits beside Smallcap's 22.34, and its Sharpe of 1.68 is still the best of the four, against 1.59 for Smallcap, 1.52 for Microcap and 1.49 for Midcap.
Return per point of pain
A cleaner way to compare the rungs is to divide the yearly return by the worst fall. It asks how much each tier paid for every point of drawdown you had to sit through. Here is Microcap, the bottom rung, on the model figures.
Allcap returns 1.97 points a year for each point of its worst fall. Microcap returns 1.41. Going smaller bought more depth and less pay for it.
Rs 100 on four rungs
The yearly figures hide the path. The monthly model values show it. Each line starts at 100 in July 2021, the first month all four have data.
From July 2021 to July 2026, Rs 100 in the Allcap model grew to about 611, Midcap to about 508, Smallcap to about 445 and Microcap to about 427.
Over sixty months the order is the opposite of the folklore: the broadest basket first, the smallest last. The rough patches tell the same story. Counting every twelve month window in the model history, Smallcap had a negative year in 7 of 51 windows, Microcap in 5, Midcap in 4 and Allcap in 2 of 49.
What the NSE size indices show
The model is a back test of RupeeCase rules. The plain NSE size indices, which hold the whole band with no screen, are a useful second look. Over the two years to 9 Oct 2026, price only, the ladder was not a ladder at all.
Nifty Microcap 250, two year price change
NSE index closes, to 9 Oct 2026
Nifty Midcap 150
NSE index closes, to 9 Oct 2026
Nifty Smallcap 250
NSE index closes, to 9 Oct 2026
Nifty 50
NSE index closes, to 9 Oct 2026
Smaller did better than the Nifty 50 in this window, but not in size order: microcap first, then midcap, then smallcap. And the microcap index fell 28.5 percent at its worst inside those two years, against 15.6 for the Nifty 50. Two years is a short window, and the order changes from one window to the next. That instability is the point of the opening: size alone is not a dependable edge.
The free module on the size factor covers the size premium's history, liquidity limits in Indian small caps and the quality screen that makes it work. The junk problem has its own post, size matters if you control your junk, and the model strategies are on the Allcap and Microcap pages.
Questions readers ask
Do small cap stocks give higher returns than mid caps?
Not reliably. In the RupeeCase model lineup (back tested, as of 27 Apr 2026) Midcap, Smallcap and Microcap printed 38.75, 37.40 and 37.33 percent a year, a ladder that tilts down. On NSE indices over the two years to 9 Oct 2026, microcap led, midcap came second and smallcap third.
Why did the all cap basket beat every size tier?
A basket that can pick across all sizes has a wider pool to choose from and is not forced to hold the weakest names in one band. In the model lineup Allcap printed 44.70 percent a year with a Sharpe of 1.68, the best of the four (Model, back tested, as of 27 Apr 2026).
What is the size premium?
It is the idea that small companies earn more than large ones over time. On its own the evidence is weak and has faded since it was first published. Research that removes low quality companies finds a steadier premium, which is why how you pick within small caps matters more than how small you go.
The cards
3 cards. Swipe, or tap to open.
Explore next
Learn it properly, then see it applied.
- GuideLarge cap vs mid cap vs small cap: the definitions, the record and the riskSEBI's rank rule, five years of NSE index data, and the swings that come with size.
- Free module 2.2Introduction to Factors10 min read
- StrategyMidcap strategyNifty Midcap 150, 20 stocks, every 2 weeks
- StrategySmallcap strategyNifty Smallcap 250, 50 stocks, every 2 weeks
Related
- Size matters, if you control your junkSmall beats large among quality stocks and among junk stocks, yet the blended small cap average trails because most small caps are junk.Factors . . 4 min
- Size: a regime, not a ruleBanz's 5.2 percent size premium has decayed about 71 percent since publication, and on RupeeCase's own cap curve the return barely moves while the drawdown deepens.Factors . . 5 min
- The turnover tax on a factorA 5.7 percent gross premium became 4.2 after trading costs, and factors traded slower than about half the book a month tend to keep a net edge.Factors . . 6 min
Educational content only. Figures are illustrative and computed on historical or representative data for teaching purposes, not investment advice. Past performance does not guarantee future returns. Sourced from NSE, BSE, SEBI, AMFI and RBI public data.