

A backtest answers one question: "If I had run this strategy on historical data, what would have happened?" It's the only rigorous way to evaluate a systematic strategy before committing real money. No backtest, no basis for conviction.
But backtests are also notoriously easy to abuse. Every strategy looks excellent on the data it was designed on. The skill is building backtests that are honest, and reading other people's backtests with appropriate scepticism. After years of building systematic strategies, I can tell you: most back tests you'll come across are optimistic. Some are outright deceptive.
- Point in time dataNo future peeks; companies that later died stay in.
- Full cost stackSTT, stamp duty, fees, GST and slippage on every trade.
- Out of sampleTest on years the rules never saw.
- Stress windowsInclude crashes like 2008 and 2020.
- Small and liveReal money, small size, before full size.
Skip any one of those and the back test flatters itself. Skipping costs alone can add a couple of percentage points a year to a strategy that trades often, as Module 1.5 showed with real rates.
What a backtest actually does
The key discipline: every calculation at each historical date must use only data available at that point in time. You cannot use today's knowledge to make decisions that were simulated in 2015. This sounds obvious, but it's violated constantly.
The three biases that make backtests misleading
The honest backtest checklist
The golden rule: A backtest can tell you what would have happened. It cannot tell you what will happen. Use it to eliminate strategies that couldn't have worked, not to guarantee strategies that will work. The best backtests are honest about this distinction.
A worked example: back calculated versus live
NSE gives you a clean natural experiment. Its factor indices are launched on a date, and NSE also publishes their history from before that date by applying the rules to past data. Everything before launch is a back test. Everything after is live. Look at what happened.
Total return CAGR to 30 Sep 2026: since 2005 (mostly back calculated) against the last 5 years (live)
- Momentum 30, since 200518.30%
- Momentum 30, last 5 years9.28%
- Quality 30, since 200516.64%
- Quality 30, last 5 years6.40%
- Nifty 200, last 5 years8.30%
Source: NSE Indices factsheets, 30 Sep 2026. Nifty200 Momentum 30 launched 25 Aug 2020; NIFTY200 Quality 30 launched 17 Apr 2018. History before launch is NSE's back calculation.
Both indices kept beating or roughly matching their parent universe after launch. Neither came close to the number in its long history. That is not fraud and it is not failure. It is what every honest back test looks like once the future arrives: the edge survives, smaller and bumpier. Size your expectations to the live number, not the brochure number.
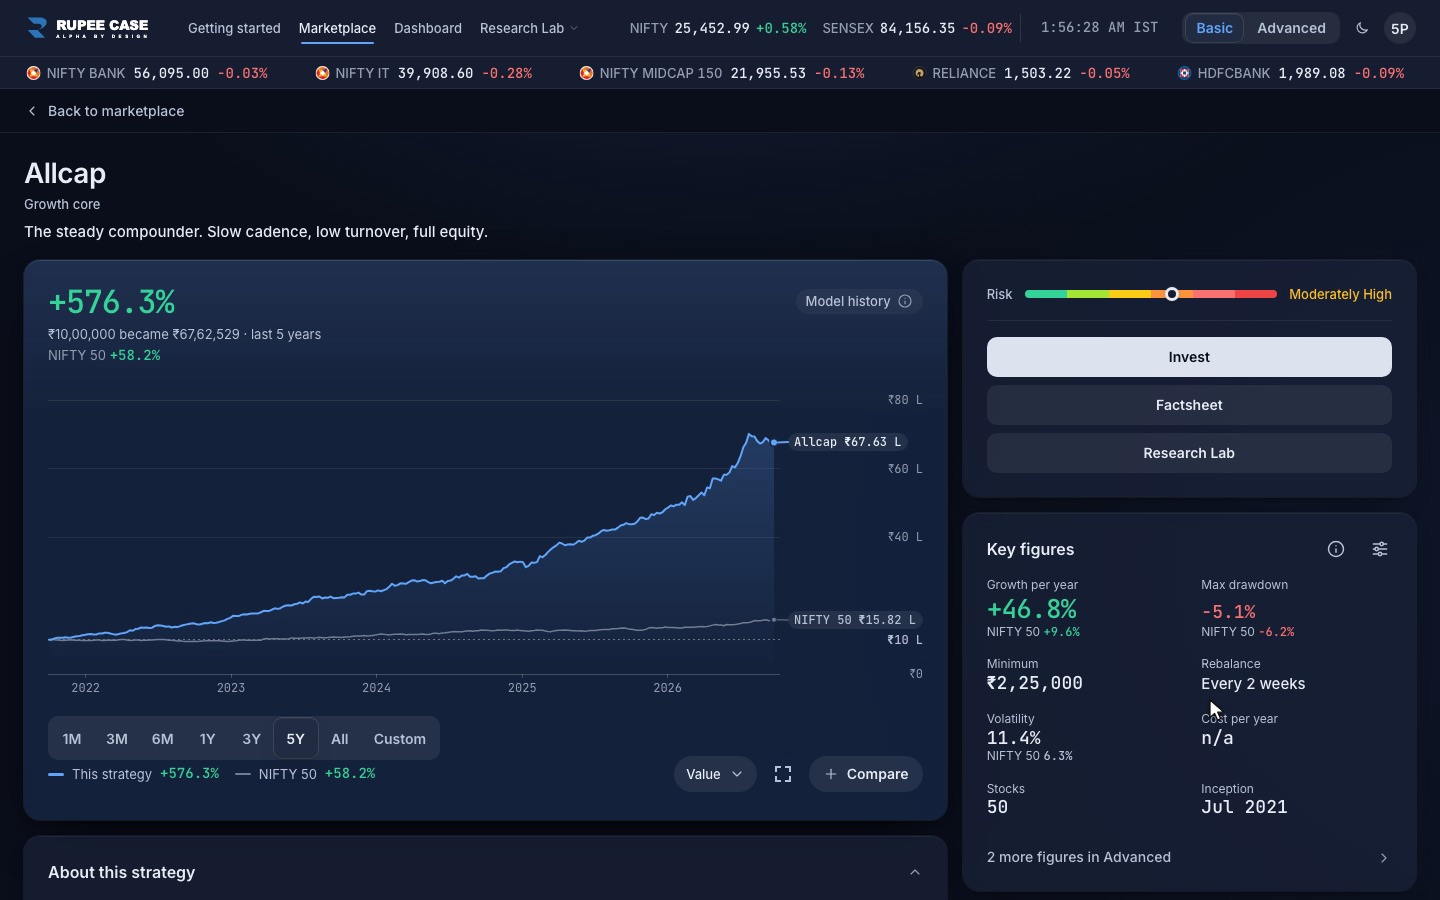
Apply the same eye to any strategy, including the ones on RupeeCase. The lineup's strategy pages show a model, back tested history over a rolling window of about five years, starting in 2021. That window does not include 2008 or the 2020 crash. It does include the 2024 to 2025 correction, which is why the worst drawdowns on those pages sit there. Read every figure with the window in mind.
What would you do?
A strategy shows 38% CAGR, a Sharpe of 3.1 and no drawdown table. Back tested from 2021. One set of parameters.
- Invest, the numbers are great
Three red flags at once: a Sharpe far above what long only equity sustains, no drawdowns shown, and one hand picked parameter set. Expect the live result to be much lower.
- Ask for drawdowns, costs and nearby parameters first
Right questions. If the result holds across nearby settings, includes costs and shows its falls, it deserves a closer look. If not, you have saved yourself the lesson.
An illustration of the checklist above, not a real product.
Common mistakes when reading back tests
Taking the CAGR as a forecast. It is a description of the past under the rules. The live number is usually lower.
Ignoring the window. A five year back test from 2021 and a twenty year one from 2005 are different animals. Check the start date.
Missing the difference between model and client returns. A model ignores when you joined, how much you added and what you paid. Your own result will differ.
Trusting a perfect curve. Real strategies have ugly years. A smooth line with no falls is a warning, not a comfort.
MythA back test shows what you would have earned.
FactIt shows what a rule would have earned, on data cleaned after the fact, with costs assumed. Your own result depends on when you start, what you add and what you actually pay.
How this shows up in RupeeCase
Every return figure on RupeeCase carries the label "Model, back tested" and the date it was checked, and every strategy page shows the drawdowns and the benchmark next to the CAGR. On a strategy chart you can add indices to compare against, as in the screen below, so you can test the comparison yourself instead of taking a headline number.
What is walk forward testing?
You fit or choose the rules on one stretch of history, test them on the next stretch the rules never saw, then roll the window forward and repeat. It mimics how a strategy actually lives: decided on the past, judged on the future.
How many years of back test are enough?
Enough to include at least one full bear market and recovery. In India that usually means going back past 2020, and ideally past 2008. Shorter windows are fine if they are labelled honestly.
Why do my own returns differ from a strategy's model returns?
Start date, additions and withdrawals, rounding to whole shares, execution prices and costs all differ from the model. Module 4.4 shows how to measure your own return properly.