

Costs: MF, PMS, RupeeCase..5 min read
Funds that vanished
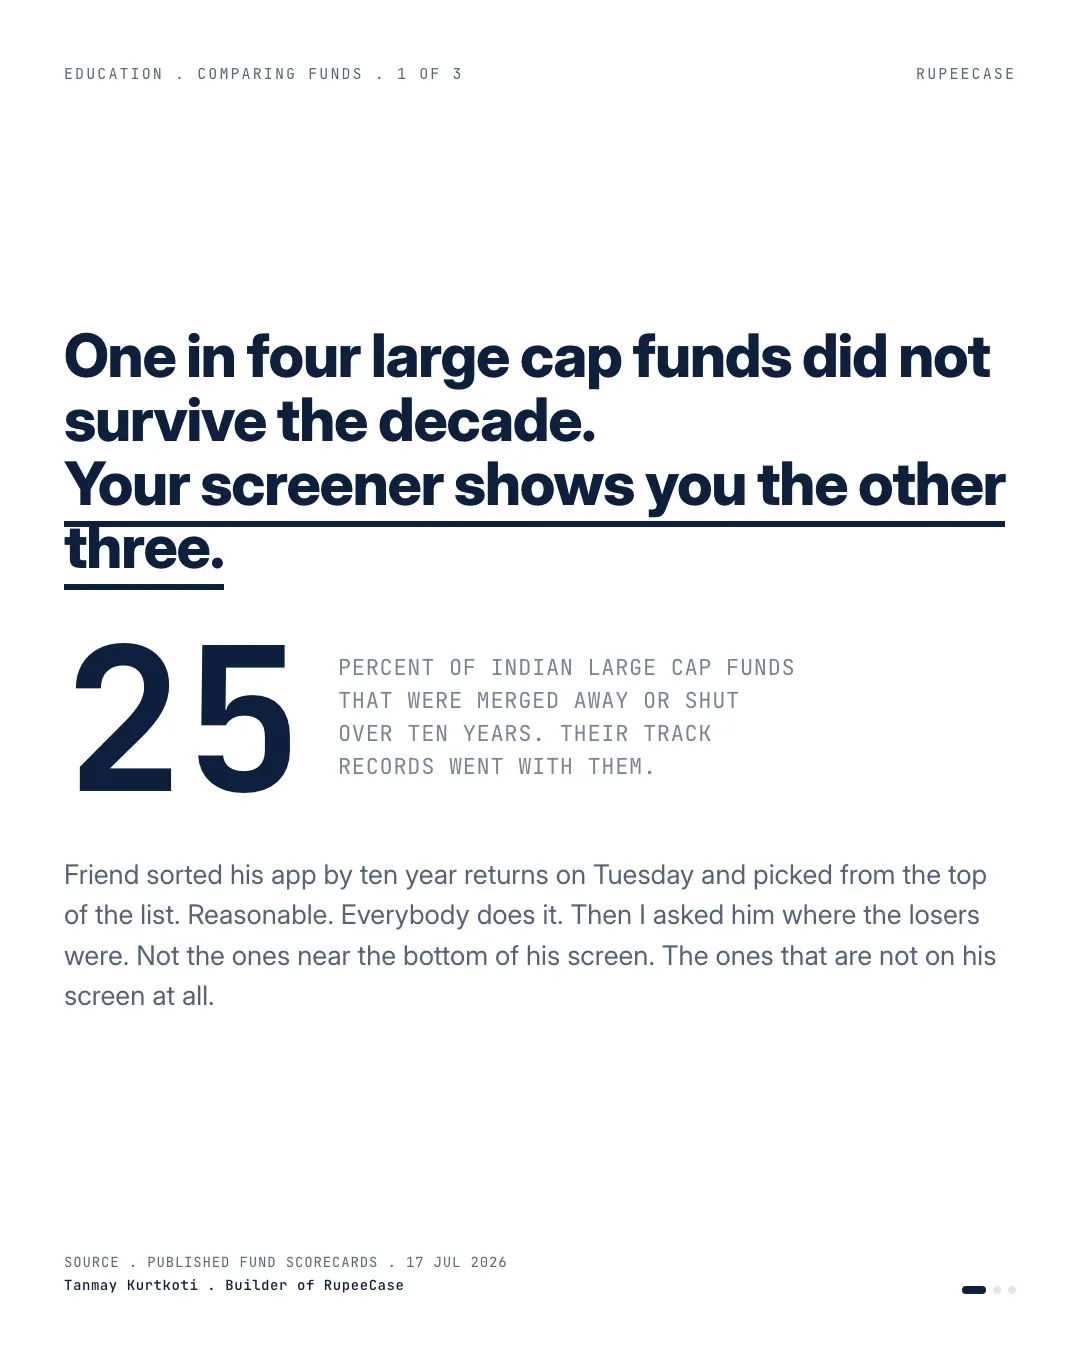
About one in four Indian large cap funds disappeared over ten years, and the category average you see is the average of the survivors.
By Tanmay Kurtkoti, founder of QC Alpha and builder of RupeeCase
Friend sorted his app by ten year returns on Tuesday and picked from the top of the list. Reasonable. Everybody does it.
Then I asked him where the losers were.
Not the ones near the bottom of his screen. The ones that are not on his screen at all.
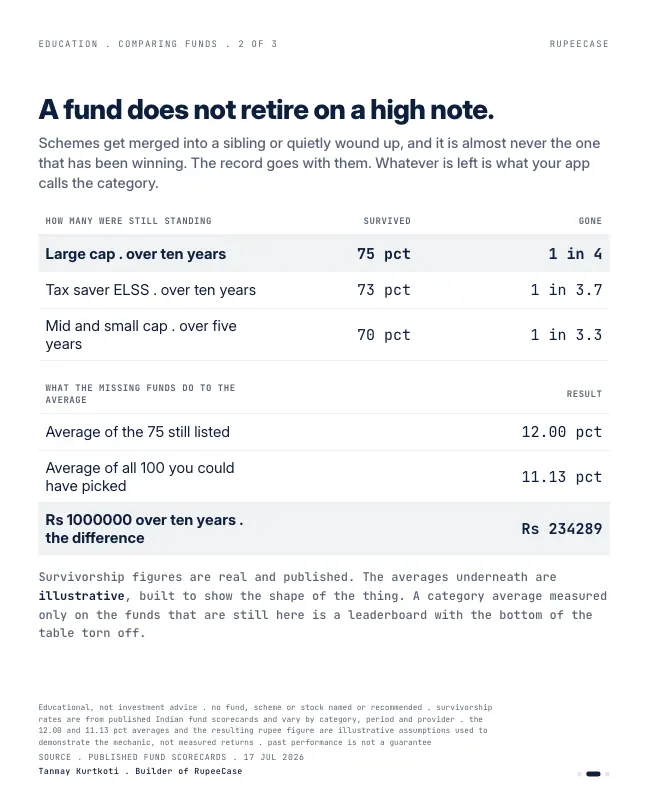
Funds do not retire on a high note. They get merged into a sibling or quietly wound up, and it is almost never the one that has been winning. Over ten years, roughly 75 pct of Indian large cap funds were still standing. Tax savers, 73. Mid and small cap, over just five years, 70. So about one in four large caps walked off the board, and the record walked off with it.
Here is the part that bothers me. Nobody moved those funds to the bottom of the ranking. They were removed from the photograph. Whatever is left is what your app then calls the category average.
The shape of it, illustratively: say the 75 still listed averaged 12 pct a year. Say the 25 that got folded away were running 8.5 when they went. The average of everything you could actually have picked on day one is 11.13, not 12. On Rs 10,00,000 over ten years that is Rs 2,34,289 of difference between the number on the screen and the number that was available to you.
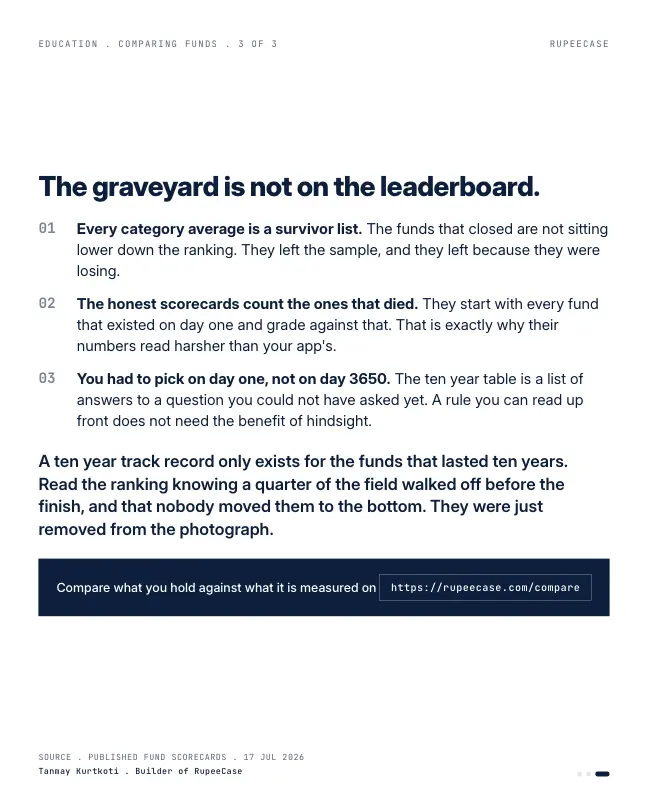
The published scorecards that count the dead ones say so out loud. They use every fund that existed at the start of the period as the denominator, on the grounds that grading only the survivors is biased in favour of the fund category. That is the whole reason their numbers read harsher than the leaderboard in your hand. Same market. One of them just refuses to bury the evidence.
Honest version: a ten year track record only exists for the funds that lasted ten years. You had to choose on day one, not on day 3650, and on day one a quarter of your options were names nobody remembers now
What the screen shows and what it hides
The ranking on an app is a photograph taken today. Every fund in it is a fund that survived until today. Here is the opening's illustration drawn out, one dot for every five funds that existed on day one.
The faded row is not a small detail. It is a quarter of the choices that were open to you on day one. You could have picked one of them, and nothing on the screen today tells you how it ended.
Run the bias on your own numbers
The bias grows with two things: how many funds disappear, and how badly they were doing when they went. If the funds that vanished were average, the bias would be zero. They rarely are, which is the whole problem.
How a fund leaves the screen in India
In India funds rarely shut down. They are merged into a sibling, and the regulator's own rules have driven two big waves of that.
- One scheme per category
SEBI standardised categories and limited fund houses to broadly one scheme in each, so overlapping schemes were merged.
- Directions on categorisation
Read with the 2017 circular, the framework fund houses now follow.
- Overlap or merge
Sectoral and thematic schemes that still overlap other equity schemes by more than 50 percent after three years must be merged.
When a merger changes a scheme's fundamental attributes, SEBI's rules give unitholders a window of 30 days to exit at the prevailing NAV without an exit load, after a written notice. That protects you as an investor. It does nothing for the leaderboard: the merged scheme's record usually ends, and the surviving scheme keeps its own.
The same trap in a back test
Survivorship is not only a mutual fund problem. It is one of the first traps in testing any rule on past data. If you test a stock strategy on today's index members, you have quietly removed every company that fell out of the index, was delisted or merged. The test only ever buys stocks that we now know survived. NSE rebalances its Nifty indices on a schedule, twice a year for the Nifty Midcap 150 and Nifty Smallcap 250, so the list in 2016 was not the list today.
MythThe category average on my app is what investors in that category earned.
FactIt is what the funds still alive earned. The ones merged away took their record with them.
The honest version of any long record, fund or back test, starts from the full list as it stood on day one. The free Learn module on how back testing works lists survivorship with look ahead bias and overfitting as the traps to check, with a quiz, and the CAGR calculator turns any start and end value into a yearly rate. Related: SEBI's overlap cap and the overlap you own and the base rate of beating the market.
Questions readers ask
What is survivorship bias in mutual funds?
It is the flattering effect of averaging only the funds that still exist. Funds that did badly are often merged away, so the category average on a screen today leaves them out. In the opening's illustration, 75 survivors at 12 percent and 25 vanished funds at 8.5 percent give a true starting average of 11.13 percent, not 12.
What happens to my money when a mutual fund is merged?
Your units are converted into units of the surviving scheme at the merger ratio. If the merger changes the scheme's fundamental attributes, SEBI's rules require a notice and a 30 day window to exit at NAV without an exit load. An exit in that window is still a redemption for tax.
How do back tests suffer from survivorship bias?
If a test uses today's index members for past years, it never holds the companies that later fell out, were delisted or merged. The rule looks better than it could have been in real time. A fair test uses the list of stocks as it stood on each past date.
The cards
3 cards. Swipe, or tap to open.
Related
- SEBI's overlap cap and the overlap you ownSEBI's February rule treats two schemes as duplicates above 50 percent overlap but carves out large caps, which is exactly where two plain funds share 60 to 80 percent.Costs: MF, PMS, RupeeCase . . 5 min
- The cost of switching fundsHopping out of a fund inside a year on a Rs 11.5 lakh pot costs about Rs 41,500 in tax and exit load, so the new fund must out earn the old by 3.6 percent before it earns a rupee.Costs: MF, PMS, RupeeCase . . 5 min
- The base rate of beating the marketSPIVA India shows 73 of 100 active large cap funds and 82 of 100 mid and small cap funds trailed their benchmark over the ten years to June 2025.Costs: MF, PMS, RupeeCase . . 5 min
Educational content only. Figures are illustrative and computed on historical or representative data for teaching purposes, not investment advice. Past performance does not guarantee future returns. Sourced from NSE, BSE, SEBI, AMFI and RBI public data.