

Portfolio construction..11 min read
The mix beats the pick
Brinson's 90 percent is about variability over time, not return; the same index at 100/0/0 and 40/40/20 trades 2.2 points of return for a worst drop of 28 instead of 52.
By Tanmay Kurtkoti, founder of QC Alpha and builder of RupeeCase
My cousin had twelve browser tabs open on a Saturday afternoon, every one of them a fund comparison page, and he had been on the same decision for two hours. Two large cap funds. Nearly identical. He could not pick.
I asked why he was sweating a coin flip. He waved the laptop shut and said the line I have now heard from more people than I can count. "Doesn't really matter which one. Asset allocation is like 90 percent of your returns anyway."
He had half remembered a real piece of research. And he had drawn from it the exact opposite of what it says.
The number he half remembered is real
There is a genuine, famous, forty year old finding underneath that comment. In 1986 three researchers, Brinson, Hood and Beebower, took 91 large American pension funds and pulled apart what drove their results. Their answer, published in the Financial Analysts Journal, was that the funds' long term policy mix, the plain split between stocks, bonds and cash, explained about 93.6 percent of the ups and downs of their returns. Security picking and market timing, the stuff everyone actually argues about, split the scraps.
They ran the study again in 1991 on a fresh batch of plans and got 91.5 percent. Different funds, different decade, basically the same headline. Pension funds were a clean place to test it too, because they are broadly diversified and do not lurch around chasing hot names, so their results really are mostly the mix doing the work.
Fourteen years later Ibbotson and Kaplan checked it on 94 balanced mutual funds and landed in the same place, about 90 percent.
Three studies, three samples, fourteen years apart. The headline barely moved, which is why the number became folklore.
- Brinson, Hood and Beebower: 93.6 percent
91 large US pension plans. Policy mix explains 93.6 percent of the variation in quarterly returns over time.
- Brinson, Singer and Beebower: 91.5 percent
A fresh set of large pension plans and a later decade. Same question, nearly the same answer.
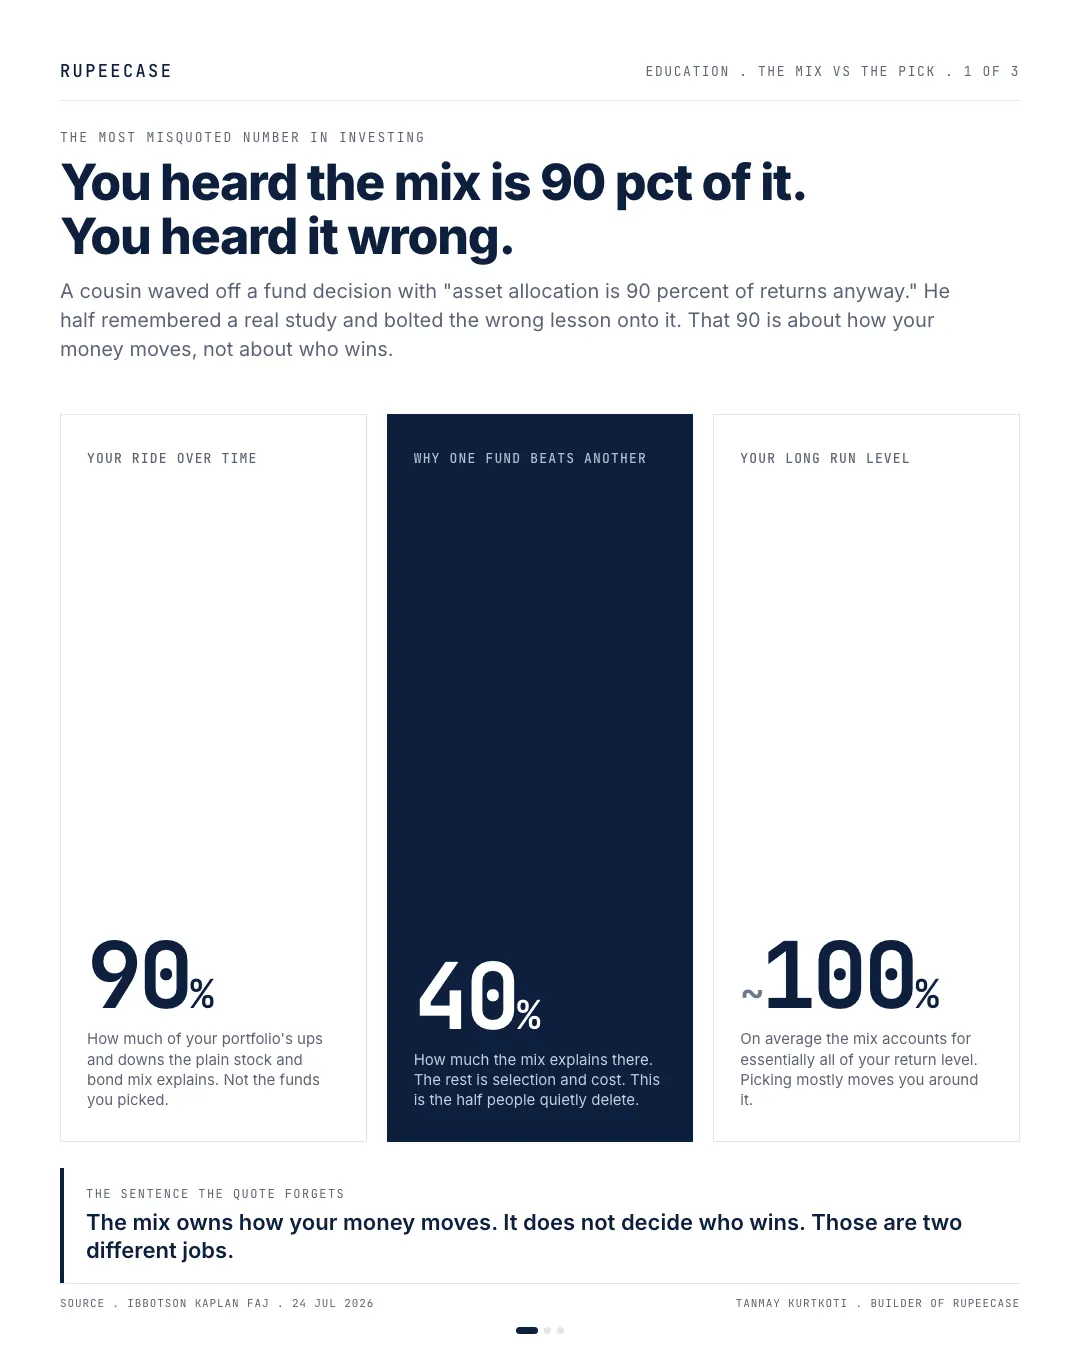
- Ibbotson and Kaplan: 90, 40 and about 100
94 balanced mutual funds. They asked three questions instead of one, and got three different answers.
So the number is not made up. My cousin was not quoting a myth. He was quoting a fact and then bolting the wrong sentence onto the end of it. If you want the plain language version of what a policy mix even is, we wrote one on the RupeeCase Learn hub. The mistake is not the number. The mistake is what people think the number is measuring.
What the ninety actually measures
Here is the part that gets lost. That 90 percent is about the variability of one portfolio over time. It answers a single narrow question. If your money bounces around month to month and year to year, how much of that bouncing is explained by your stock and bond mix rather than by which exact funds you hold?
Answer, almost all of it. Own a 70/30 portfolio and its good years and bad years will track a plain 70/30 index almost perfectly, whatever clever names sit inside the equity sleeve. Put two friends in a 70/30 mix, hand each of them a different set of large cap funds, and their charts will rise and fall together like they traced the same line. When the market has a bad quarter, both have a bad quarter. The mix is doing that, not the picks.
That is a statement about your ride. It is not a statement about your destination. Ibbotson and Kaplan actually titled their paper around three different numbers on purpose, because the same mix explains a different amount depending on which question you ask.
Read the middle bar. When you ask why one fund ended up ahead of another, the mix explains only about 40 percent. The rest is selection, style, timing and cost. So the mix owns your ride and shares your destination. My cousin heard the 90 and quietly deleted the 40.
MythAsset allocation decides 90 percent of your returns, so the fund you pick does not matter.
FactThe mix explains about 90 percent of how one portfolio moves over time. Between two funds, it explains only about 40 percent of why one finished ahead.
So I changed only the mix and held the same index
The cleanest way to feel this is to freeze the picking and move only the split. Imagine you hold the exact same equity index in every version, so your security selection never changes by a single share. All you touch is how much sits in stocks, how much in debt, how much in gold.
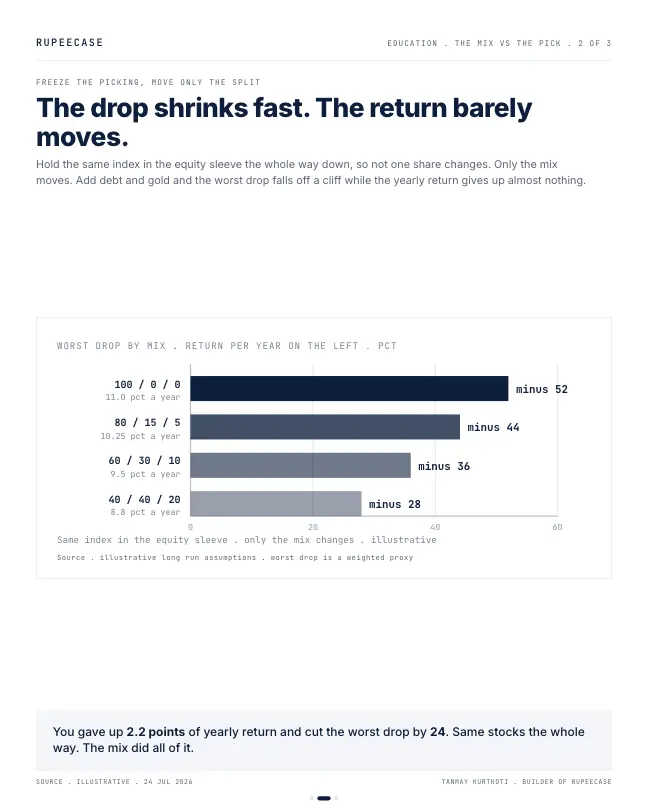
I ran a simple illustrative ladder on that idea. Same index throughout. Only the mix moves.
| Mix . equity / debt / gold | Return a year | Worst drop | Return given up |
|---|---|---|---|
| 100 / 0 / 0 | 11.0 pct | minus 52 pct | none |
| 80 / 15 / 5 | 10.25 pct | minus 44 pct | 0.75 pp |
| 60 / 30 / 10 | 9.5 pct | minus 36 pct | 1.5 pp |
| 40 / 40 / 20 | 8.8 pct | minus 28 pct | 2.2 pp |
These are illustrative numbers, not a backtest of any live product, and the worst drop is a rough weighted proxy that probably overstates the real fall, since debt, gold and equity rarely bottom on the same day. But the shape is the honest part. Walk from all equity down to a 40/40/20 mix and you hand back 2.2 percentage points of yearly return. In exchange your worst drop shrinks from about 52 percent to about 28 percent. You gave up a sliver of the return and cut almost half the pain, without changing a single stock.
The give up is small the shelter is not
That trade looks lopsided until you remember how drops actually work, and then it looks even better.
A fall and its recovery are not symmetric. Lose 52 percent and you do not need 52 percent to get back. You need 108 percent, because you are climbing out of a smaller base. Lose 28 percent and you need about 39 percent. The deeper hole is not a bit harder to escape. It is more than twice as hard.
So the mix is not buying you a softer feeling. It is buying you a shorter climb. That 2.2 point give up looks like a cost until you price in the years you did not spend clawing back to where you started. The boring split earns its keep in exactly the market my cousin was terrified of, and he was about to skip it to argue over two funds that would move together anyway.
How long the climb takes, in years
A percentage needed to get back is still abstract. Years are not. Take the two ends of the ladder: the all equity mix falls 52 percent and then earns its 11 percent a year, the 40/40/20 mix falls 28 percent and earns 8.8 percent. On Rs 10,00,000, the first is left with Rs 4,80,000 and the second with Rs 7,20,000. Put those numbers in and see how long each takes to be whole again.
At 52 percent and 11 percent it is about 7 years. Change the inputs to 28 and 8.8 and it is about 3.9 years. The lower return mix gets home three years sooner, because it fell into a shallower hole. That is the trade the free Learn module on modern portfolio theory builds from scratch: what a holding does to the whole portfolio matters more than its own return.
Two decisions wear the same word
The trap in that Saturday afternoon was that he thought he was making one decision. He was making two, and he was pouring all his energy into the smaller one.
The mix decides the shape of your journey. The pick decides who finishes ahead of whom, between two people who chose the same journey. Both are real. They are just not the same size, and they are not the thing you should spend the same number of Saturday hours on. If you want to see a steady mix set next to a single sleeve bet, our compare view lets you read the drops, not only the destinations.
The honest half, because the ninety gets abused
Now the part that keeps me honest, and it cuts against the neat story.
The same test on our own shelf
We can run the frozen pick test on real model data, because two strategies on the RupeeCase shelf share one equity engine. Allcap holds 100 percent equity. Allcap Multi Asset holds the same kind of equity sleeve at 80 percent, with 10 percent in debt and 10 percent in gold. Only the mix differs.
- Allcap, max drop-22.72%
- Allcap Multi Asset, max drop-21.32%
Max drawdown. Model, back tested, as of 27 Apr 2026. RupeeCase lineup.json. CAGR 44.70 and 40.47 percent, Sharpe 1.68 and 1.81.
The mix gave up about 4.2 points of model CAGR, 44.70 percent against 40.47 percent, and bought a shallower worst drop and a Sharpe of 1.81 against 1.68 (Model, back tested, as of 27 Apr 2026). The gap is smaller than in the ladder because only 20 percent moved out of equity, but the direction is the same. The asset allocation as alpha note runs the same idea on a longer horizon.
That 40 percent is not a footnote. Selection and cost really do decide who wins. Two funds that both run 60/40 can finish in very different places, and if you pick the wrong one you feel every basis point of it. Anyone who tells you the pick is free money is selling the myth from the other direction.
Here is the sting though. When Vanguard's researchers checked which side of that 40 percent investors actually landed on, the average picker lost. Across balanced funds from 1966 to 2003, active management on average reduced returns and increased volatility against a simple indexed version of the same policy mix. About 61 percent of balanced funds underperformed their own policy benchmark over a ten year stretch. So the pick matters, and most of the time it matters against you. The main reason is dull and it is cost. Every extra layer of fee is a head start you spot the index, and most pickers never make it back. That does not argue for obsessing over the pick. It argues for getting the mix right, then keeping the picking cheap and boring, because expensive picking has a long history of subtracting.
Three rules I keep coming back to
Decide the mix first. It sets your ride and your worst year, and it is the one lever with a reliable payoff. Choose it before you open a single fund comparison tab.
Read the 90 as variability, not destiny. It says your ride will track your mix. It never promised that picking is free, and it never said the mix decides who wins.
Rebalancing is how you keep the split you chose. A mix you set on day one and never tend drifts back toward all equity through a bull run, and hands you the full 52 percent drop right when you thought you had bought the 28. Setting the mix before the picks and then holding it is the whole game, which is the order our methodology is built around.
My cousin closed the tabs. He picked the cheaper of the two funds in about a minute, then spent the rest of the afternoon on the question that actually moves his money, how much of it should be in stocks at all.
The brochure sells you the pick. The math pays you for the mix.
Questions readers ask
Does asset allocation really explain 90 percent of returns?
It explains about 90 percent of how one portfolio's returns vary over time, according to Brinson, Hood and Beebower (1986) and Ibbotson and Kaplan (2000). It explains only about 40 percent of why one fund beats another with a similar mix. The fund you pick still matters, mostly through its cost.
How long does it take to recover from a 50 percent fall?
A 50 percent fall needs a 100 percent gain to break even. At a steady 11 percent a year that takes about 6.6 years; at 8 percent, about 9 years. A shallower fall shortens the climb far more than a slightly higher return does.
The cards
3 cards. Swipe, or tap to open.

Explore next
Learn it properly, then see it applied.
Reading path
Stop 4 of 10 on Start here
Related
- The cash dial, not the stock listRisk appetite picks how much of the highest Sharpe portfolio to hold, not which stocks; swapping to a defensive basket instead costs about Rs 7.8 lakh on Rs 10 lakh over twenty years.Portfolio construction . . 5 min
- The split decides more than the pickBrinson's finding is about variability, not return, and holding the same index at 100/0/0 versus 40/40/20 trades two points of return for 34 points of drawdown.Portfolio construction . . 5 min
- Who sells first: a household's real risk levelA shared portfolio is held by consensus and sold by veto, so the account's risk level is the lower partner's tolerance, not the average.Portfolio construction . . 4 min
Educational content only. Figures are illustrative and computed on historical or representative data for teaching purposes, not investment advice. Past performance does not guarantee future returns. Sourced from NSE, BSE, SEBI, AMFI and RBI public data.